
Sketchbook: Wallpapers of 2025, part 1
Jan. 14th, 2026 05:01 am
Previews of the bonus wallpapers that Leif & Thorn patrons got this year. All the wallpaper posts are collected here…and if you don’t want an ongoing subscription, Patreon lets you make a one-time purchase of the whole set.
And a shiny new Off-Shoots bonus for $5-and-up supporters: Original concept sketches for The Traveler!

January: Flower Hammock
Leif, Thorn, a cozy floral hammock, a clear spring day with blue skies.
February: Hearts and mask
Inspired by the ship ask meme I’m doing over on Tumblr. Specifically, inspired by these answers about Dex and Hermosa.
March: Bottled goths + Bonus bottles
Fifth and final entry in the series of “Knights in a bottle“, “Secret Order of Bottled Hunters“, “Magic in a bottle,” and “Bottled Embassy grounds.” This one features just Hyacinth and Hazel.
Includes a patron-exclusive look at the chibis where I drew the lineart, but never finished the colors. (Lulen Lilblomma, Marula Sheaver, and President Olive Romarin.)
April: Little showers
Rain-themed wallpaper. Kid versions of Leif and Thorn, huddling under a shared umbrella.
May: bottle collection!
After drawing so many bottled chibis, I wanted to finally come out with a piece that put all of them together!
(…I’m not putting them all in the character tags, though.)
June: Lavandes in a line
Hyacinth with brother Hawthorn riding piggyback, her parents Tansy and Larch following hand-in-hand, all trying to power-walk away from Larch’s parents Gloriosa and Oleander.
Pose from Draw Everything June 2025, an annual challenge run by AdorkaStock.
Fires on the Rise in the Far North
Jan. 14th, 2026 05:00 am
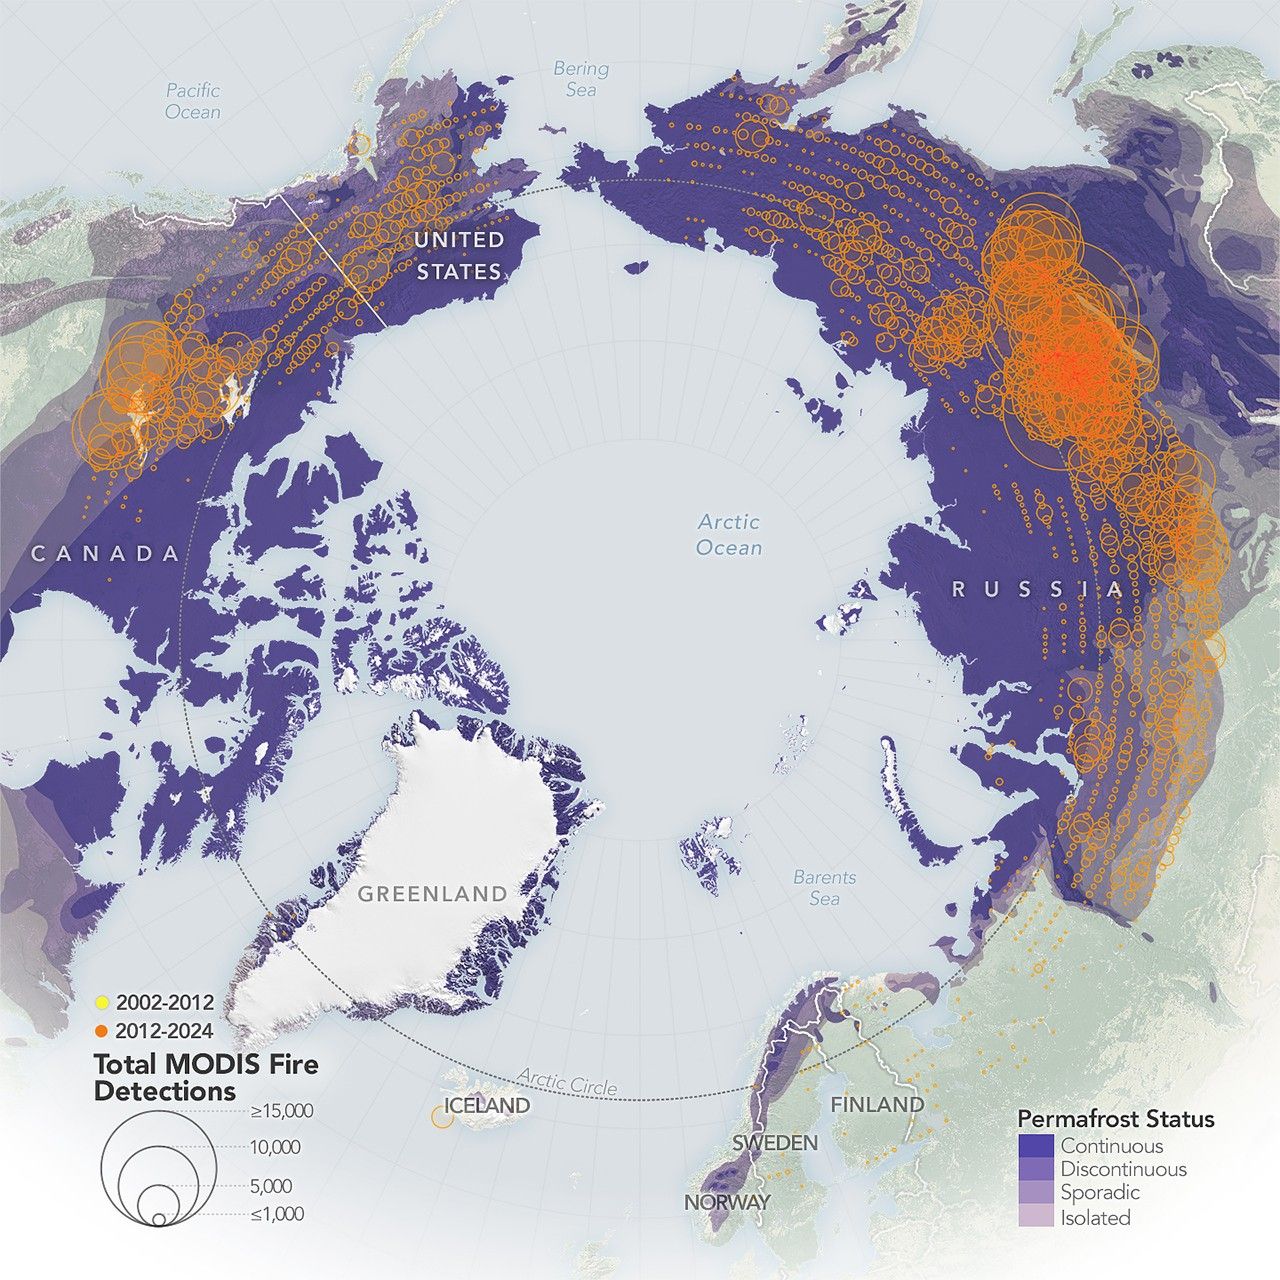


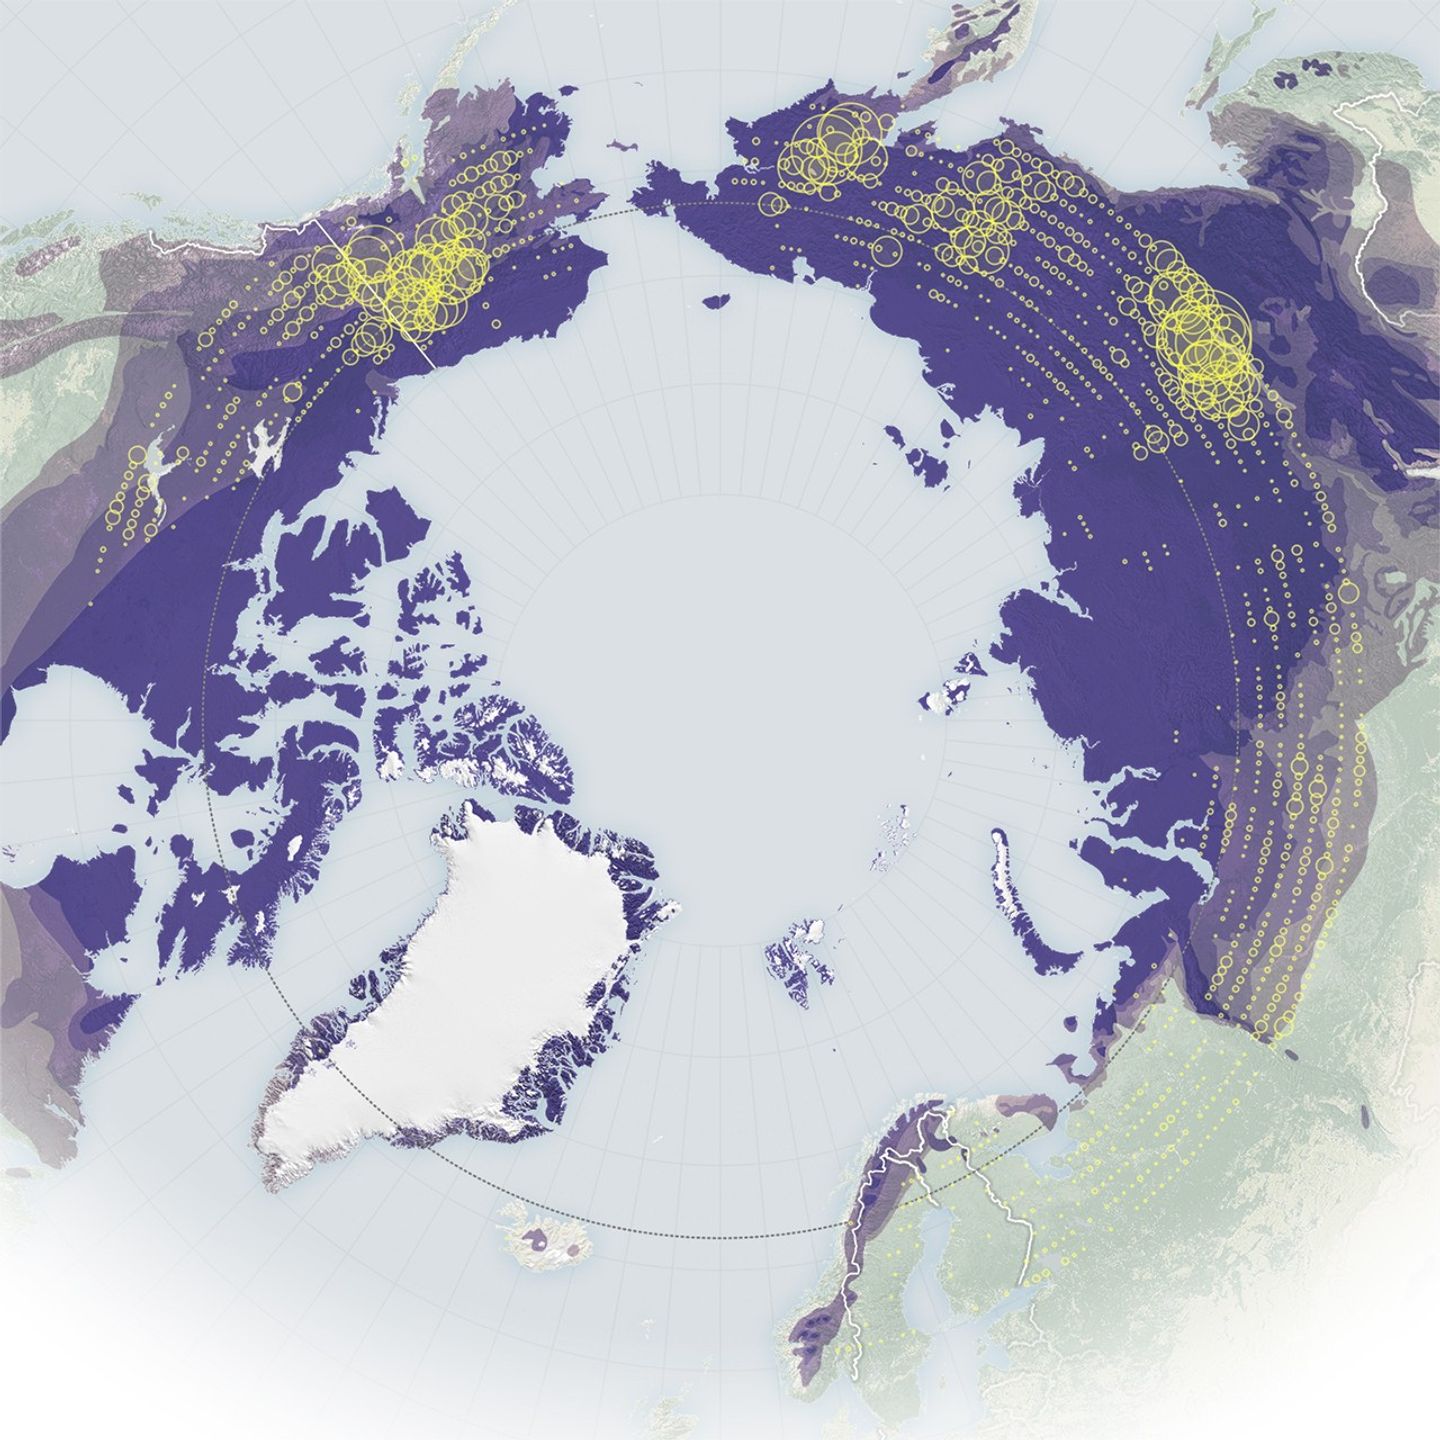
In the far north, wildfires are breaking old patterns. Satellite data show that wildland fires once scattered across the Arctic are now surging in numbers—particularly in northern Eurasia—and many are burning more intensely than before.
These maps show the number of fires detected by the MODIS (Moderate Resolution Imaging Spectroradiometer) sensors on NASA’s Aqua and Terra satellites. The map on the left shows fire detections from 2002 to 2012 (yellow), while the map on the right shows detections from 2012 to 2024 (orange). The largest circles indicate areas with 15,000 or more detected fires, while the smallest circles represent areas with 1,000 or fewer. Fire detection data are from NASA’s Fire Information for Resource Management System (FIRMS).
Although the geographical distribution of high-latitude wildfires varies from year to year, the maps reveal some clear long-term patterns. In the 2000s, fires north of 60 degrees latitude appeared across both North America and Eurasia, but starting in the early 2010s, their numbers skyrocketed, most dramatically in Eurasia. Even the icy island of Greenland entered a new fire regime during this period, experiencing more large fires, though still too few to be visible on these maps.
Researchers attribute these trends to rising temperatures, which have made northern landscapes more flammable, along with a poleward expansion of lightning—the primary ignition source for these fires. The findings are detailed in a report published in 2025 by the Arctic Monitoring and Assessment Programme (AMAP), a working group of the Arctic Council.
The number of fire detections and their distribution, however, is just one metric of the Arctic’s changing fire regime. According to NASA researchers, fires in this region are also burning larger, hotter, and longer than they did in previous decades.
“Fire has always been a part of the boreal and the Arctic landscape,” said Jessica McCarty, Deputy Earth Science Division Chief at NASA’s Ames Research Center and lead author of the report. “But now it’s starting to act in more extreme ways that mimic what we’ve seen in the temperate and the tropical areas.”
NASA Earth Observatory maps by Michala Garrison, using the MODIS Collection 6.1 Active Fire Product from NASA’s Fire Information for Resource Management System (FIRMS). Story by Milan Loiacono.
References & Resources
- Arctic Monitoring and Assessment Programme (2025, June) AMAP Arctic Climate Change Update 2024: Key Trends and Impacts. Accessed January 14, 2026.
- NASA (2026) Fire Information for Resource Management System. Accessed January 14, 2026.
- NASA Earth Observatory (2026, January) Fire on Ice: The Arctic’s Changing Fire Regime. Accessed January 14, 2026.

You may also be interested in:
Stay up-to-date with the latest content from NASA as we explore the universe and discover more about our home planet.
The fast-growing blaze charred more than 100,000 acres in the span of a week.

As wildland fires raged in the American West, NASA airborne technology was there to image it in incredible detail.
The blaze in central Utah experienced rapid growth during dry, windy days in late July 2025, creating hazy skies throughout…


The post Fires on the Rise in the Far North appeared first on NASA Science.

A Plume of Bright Blue in Melissa’s Wake
Jan. 13th, 2026 05:01 am

Before and After
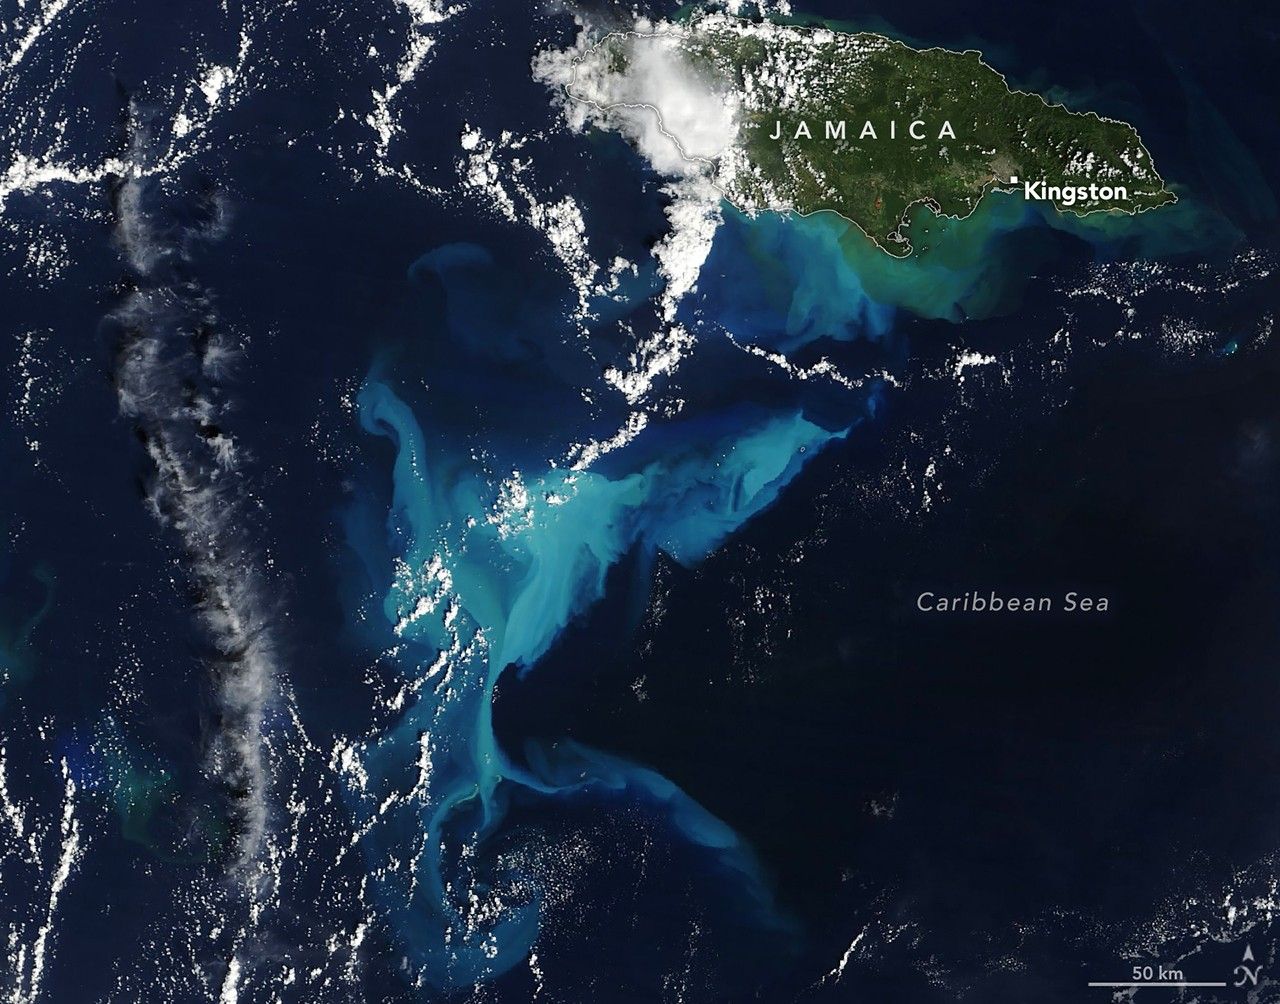
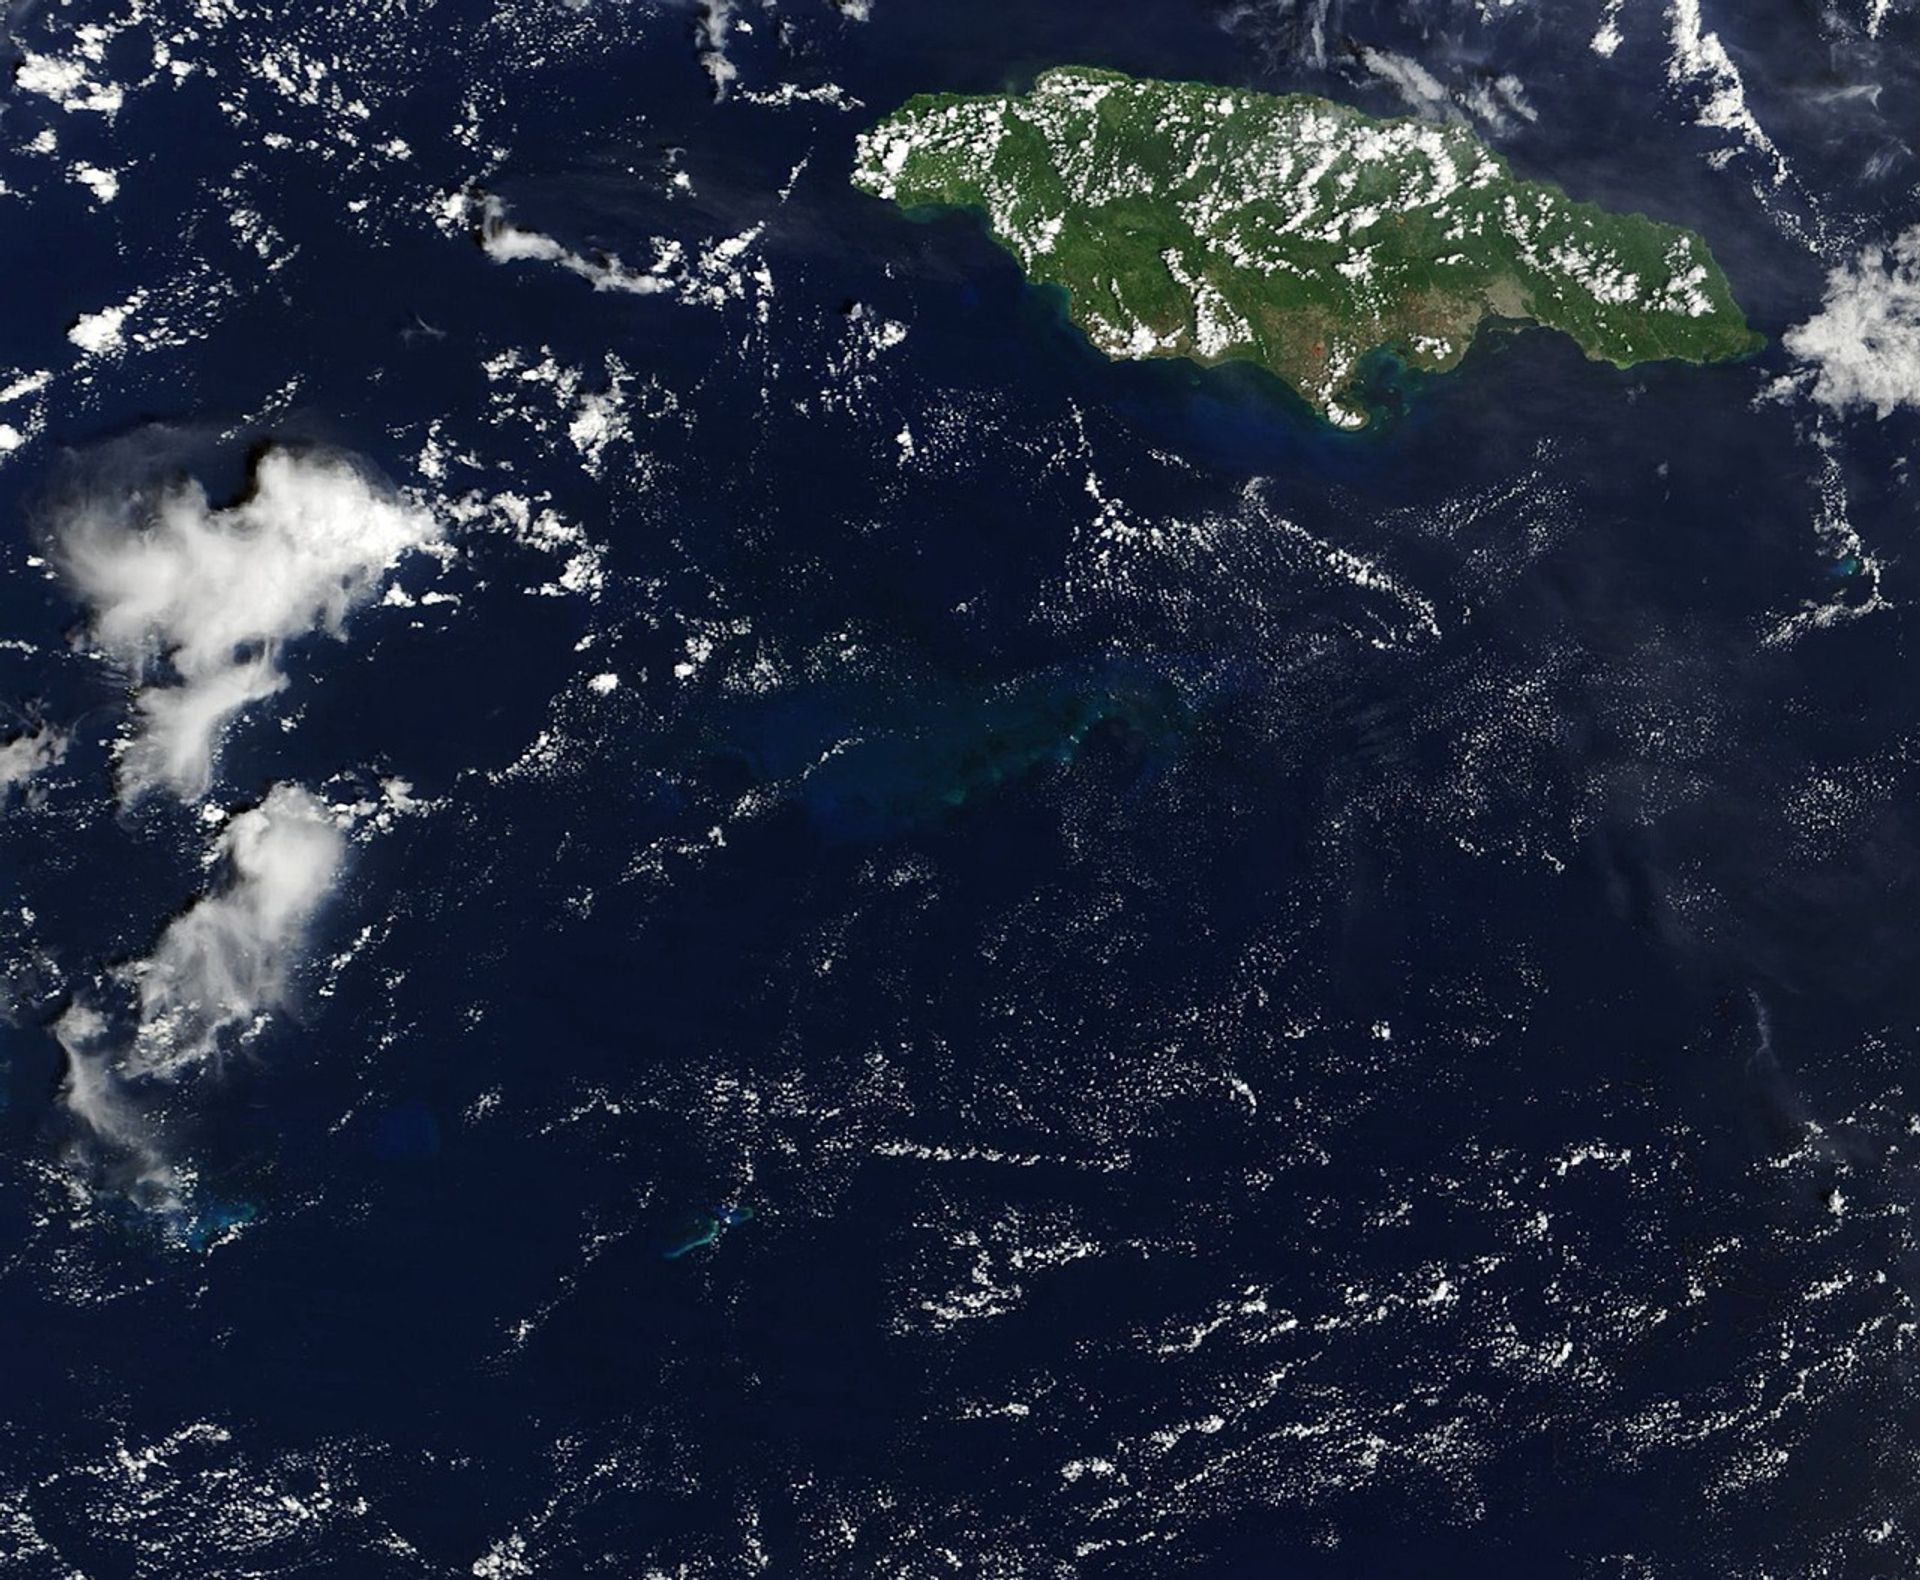
Hurricane Melissa made landfall in Jamaica on October 28, 2025, as a category 5 storm, bringing sustained winds of 295 kilometers (185 miles) per hour and leaving a broad path of destruction on the island. The storm displaced tens of thousands of people, damaged or destroyed more than 100,000 structures, inflicted costly damage on farmland, and left the nation’s forests brown and battered.
Prior to landfall, in the waters south of the island, the hurricane created a large-scale natural oceanography experiment. Before encountering land and proceeding north, the monster storm crawled over the Caribbean Sea, churning up the water below. A couple of days later, a break in the clouds revealed what researchers believe could be a once-in-a-century event.
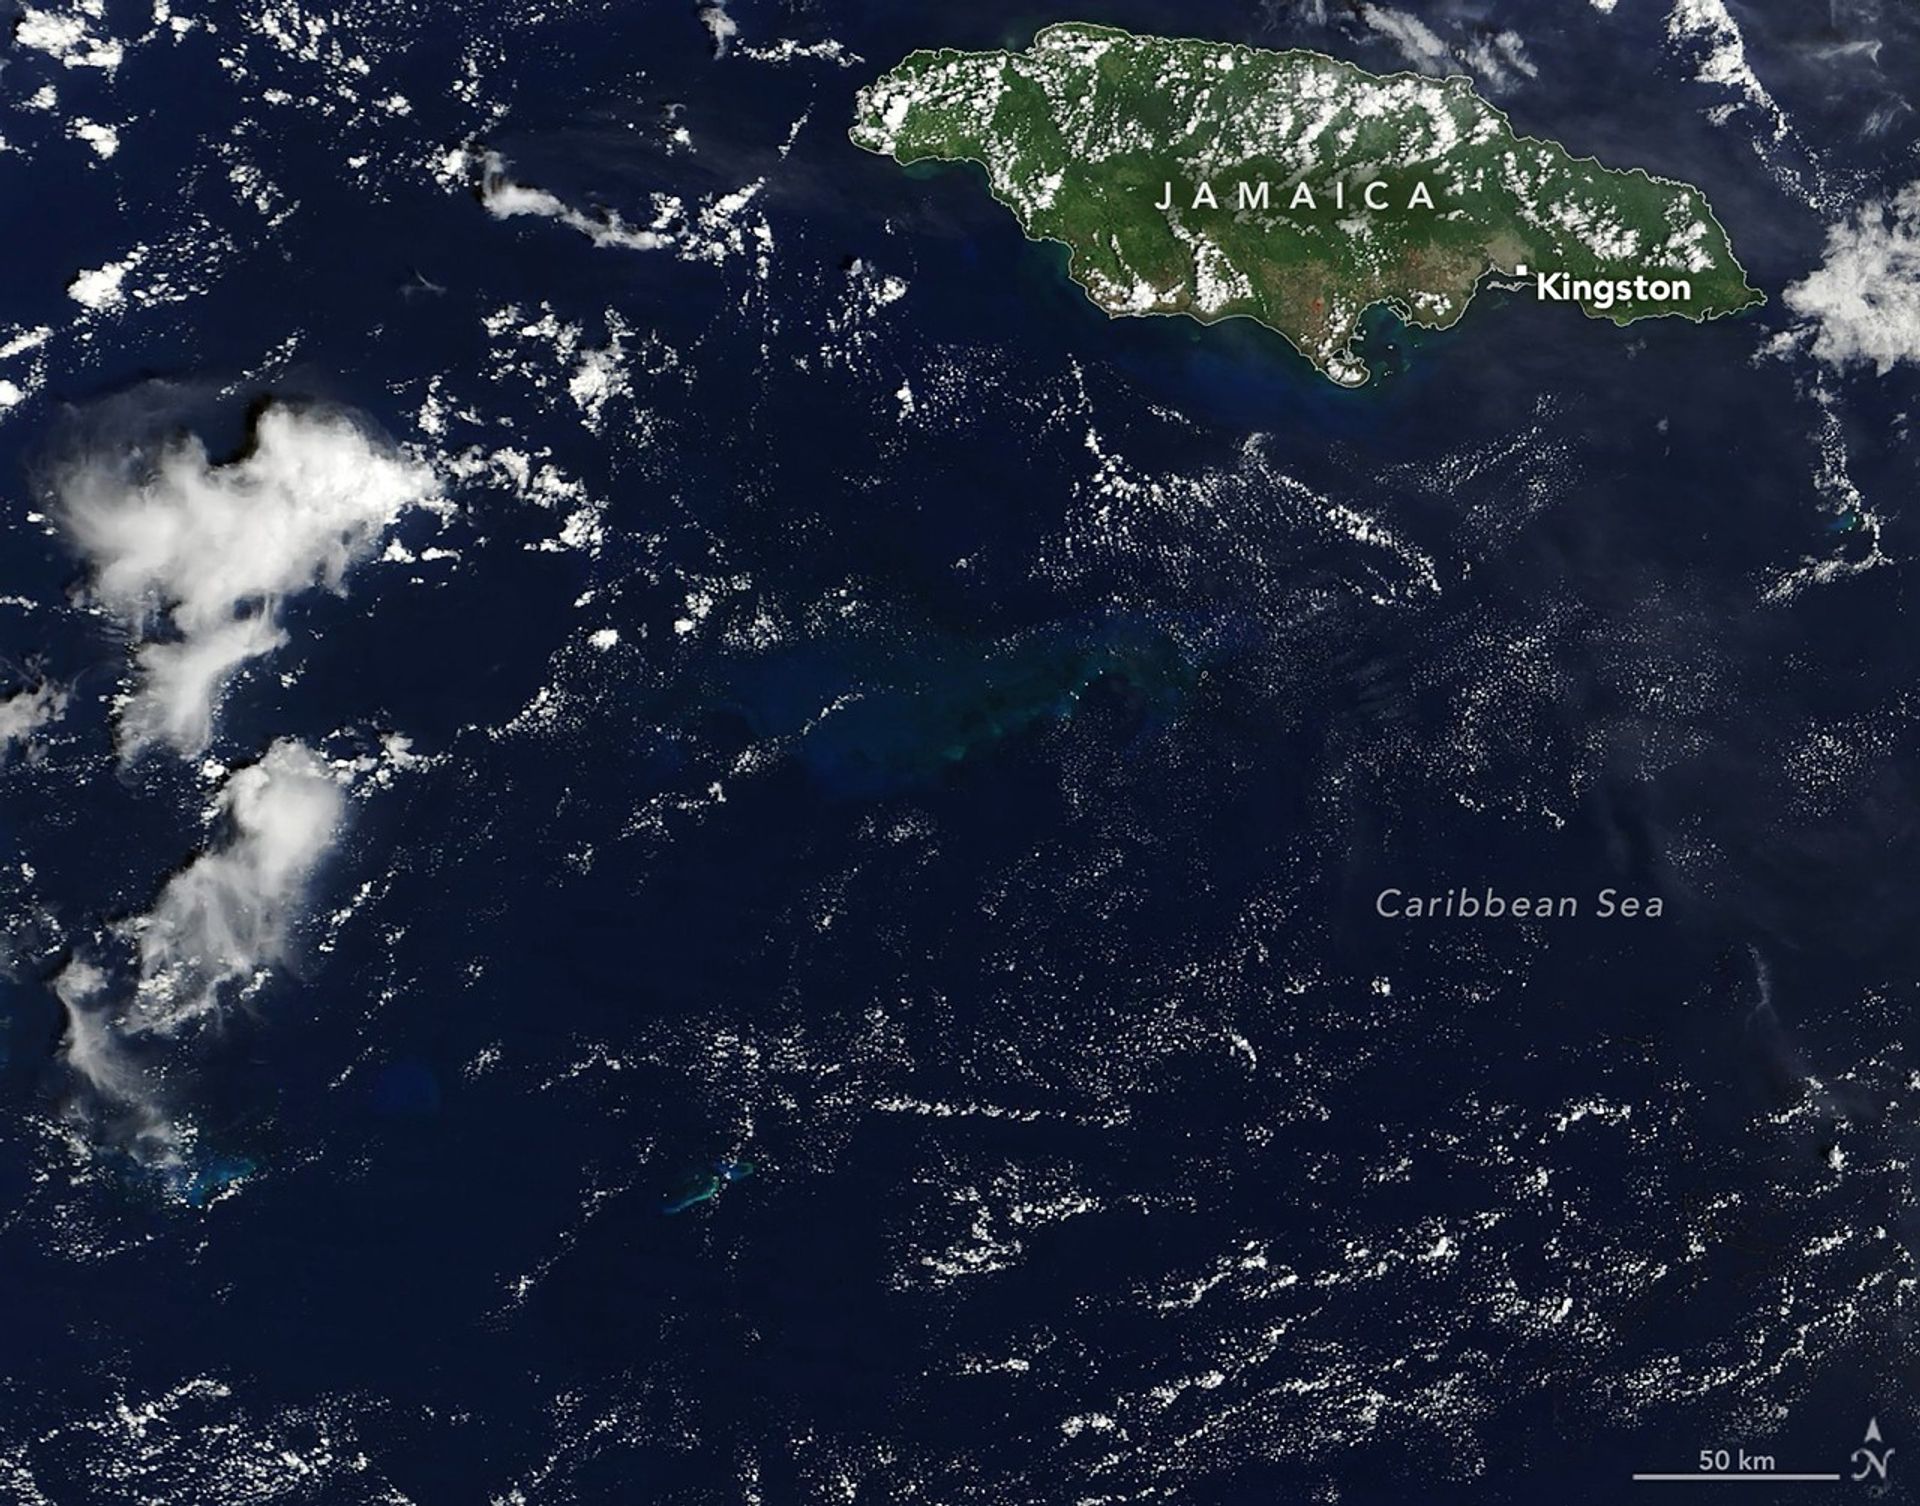
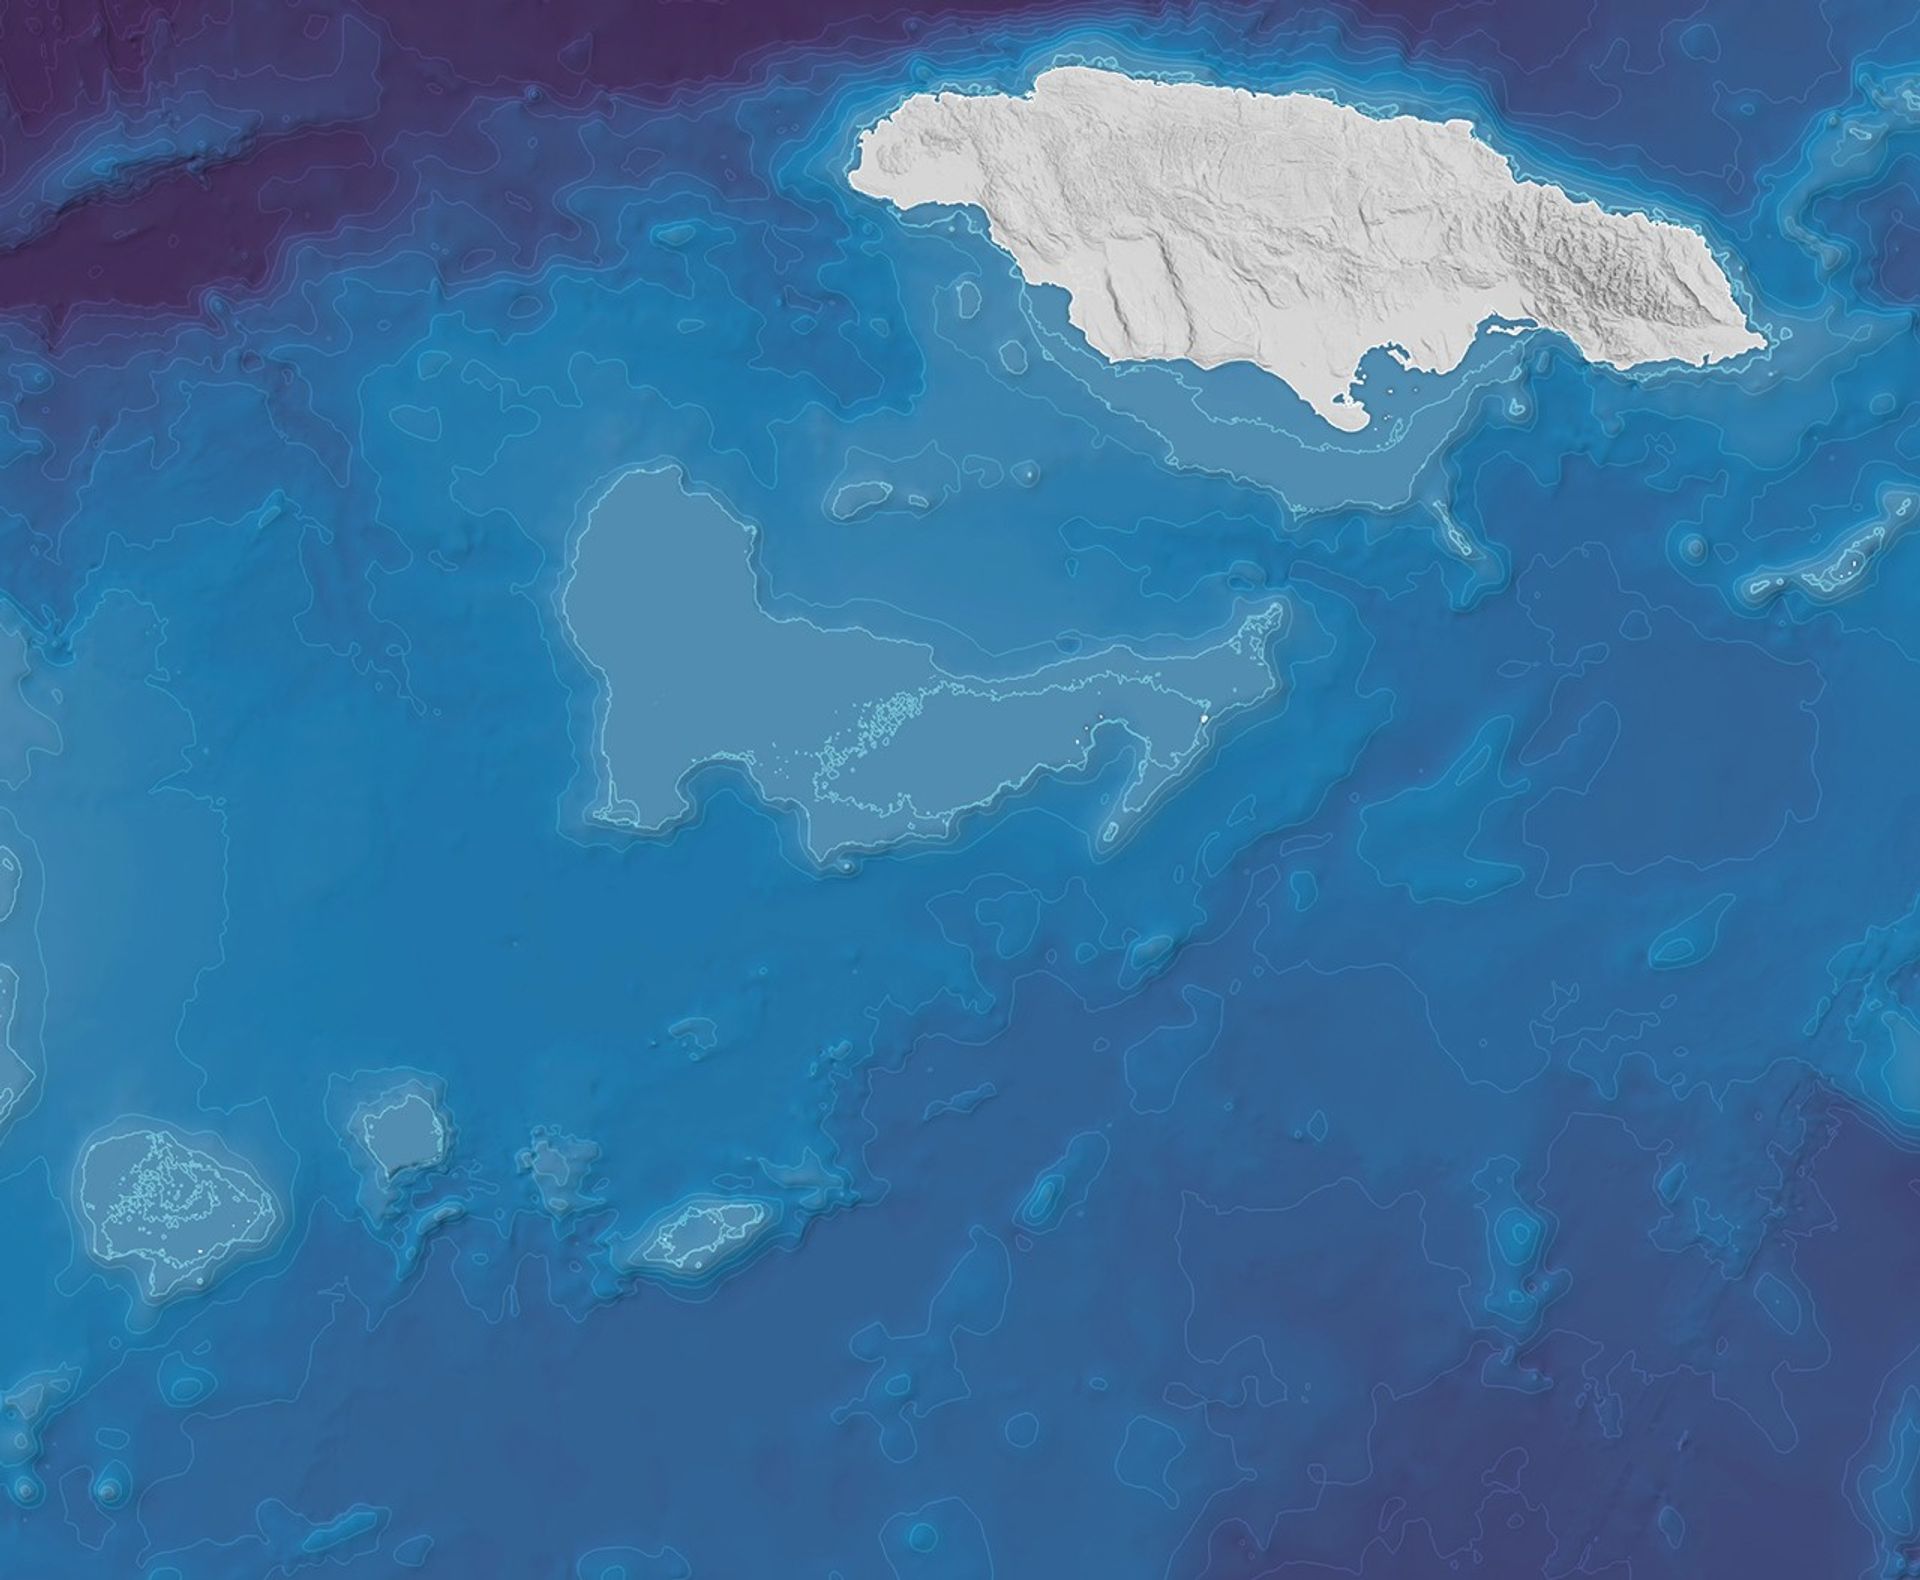
On October 30, 2025, the MODIS (Moderate Resolution Imaging Spectroradiometer) instrument on NASA’s Terra satellite acquired this image (right) of the waters south of Jamaica. Vast areas are colored bright blue by sediment stirred up from a carbonate platform called Pedro Bank. This plateau, submerged under about 25 meters (80 feet) of water, is slightly larger in area than the state of Delaware. For comparison, the left image was acquired by the same sensor on September 20, before the storm.
Pedro Bank is deep enough that it is only faintly visible in natural color satellite images most of the time. However, with enough disruption from hurricanes or strong cold fronts, its existence becomes more evident to satellites. Suspended calcium carbonate (CaCO3) mud, consisting primarily of remnants of marine organisms that live on the plateau, turns the water a Maya blue color. The appearance of this type of material contrasts with the greenish-brown color of sediment carried out to sea by swollen rivers on Jamaica’s southern coast.
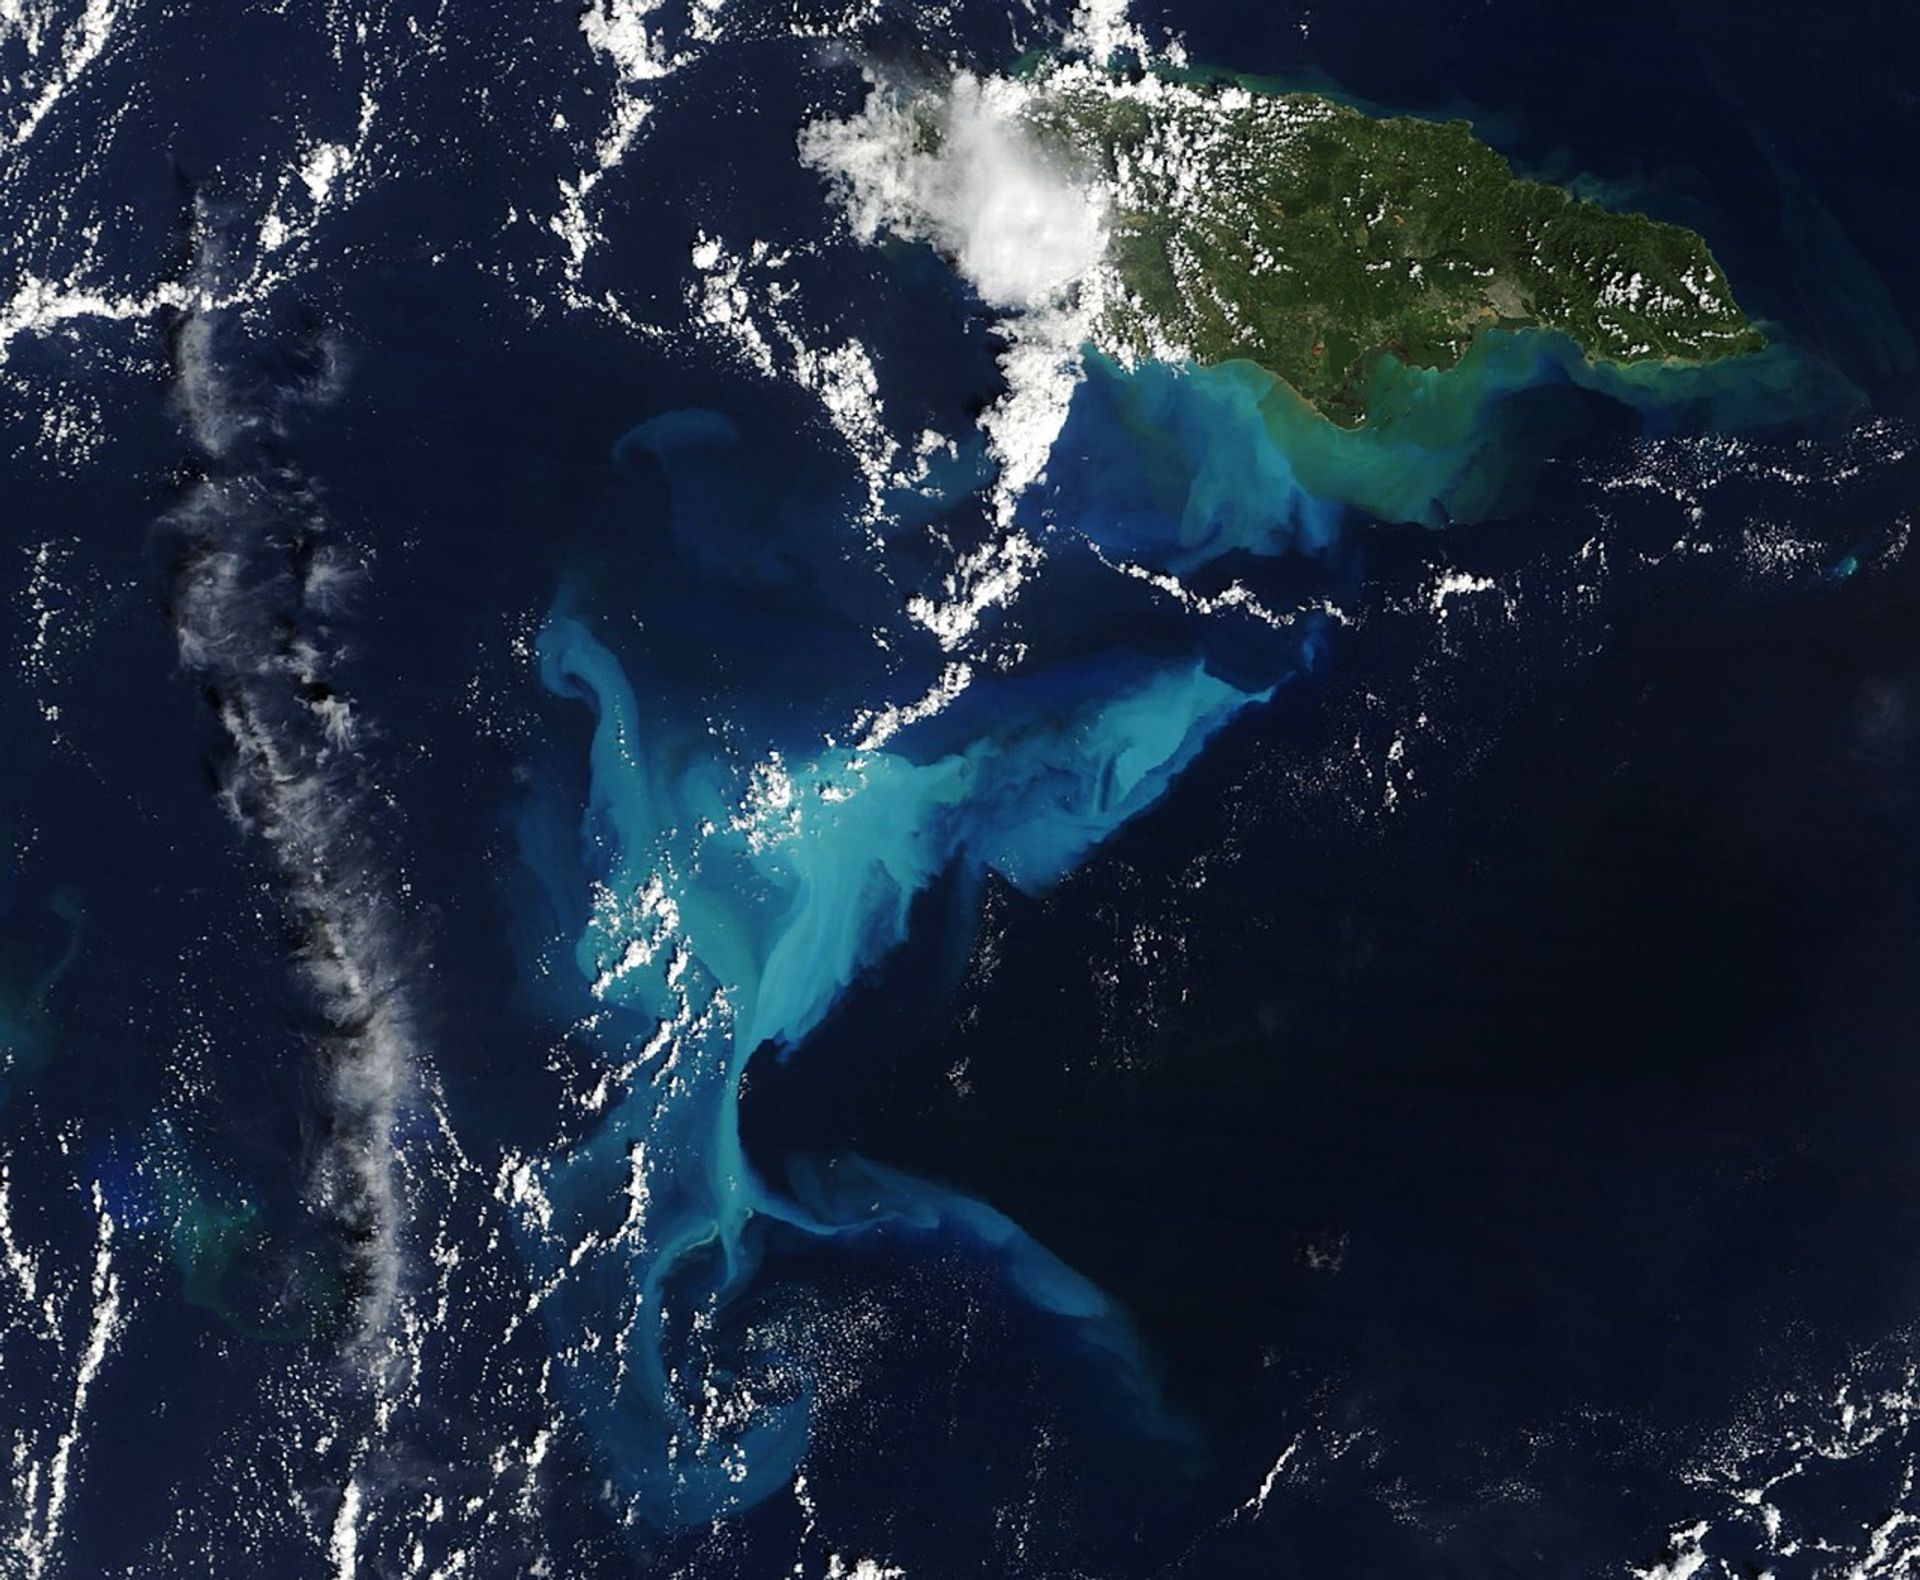
As an intense storm that lingered in the vicinity of the bank, Hurricane Melissa generated “tremendous stirring power” in the water column, said James Acker, a data support scientist at the NASA Goddard Earth Sciences Data and Information Services Center with a particular interest in these events. Hurricane Beryl caused some brightening around Pedro Bank in July 2024, “but nothing like this,” he said. “While we always have to acknowledge the human cost of a disaster, this is an extraordinary geophysical image.”
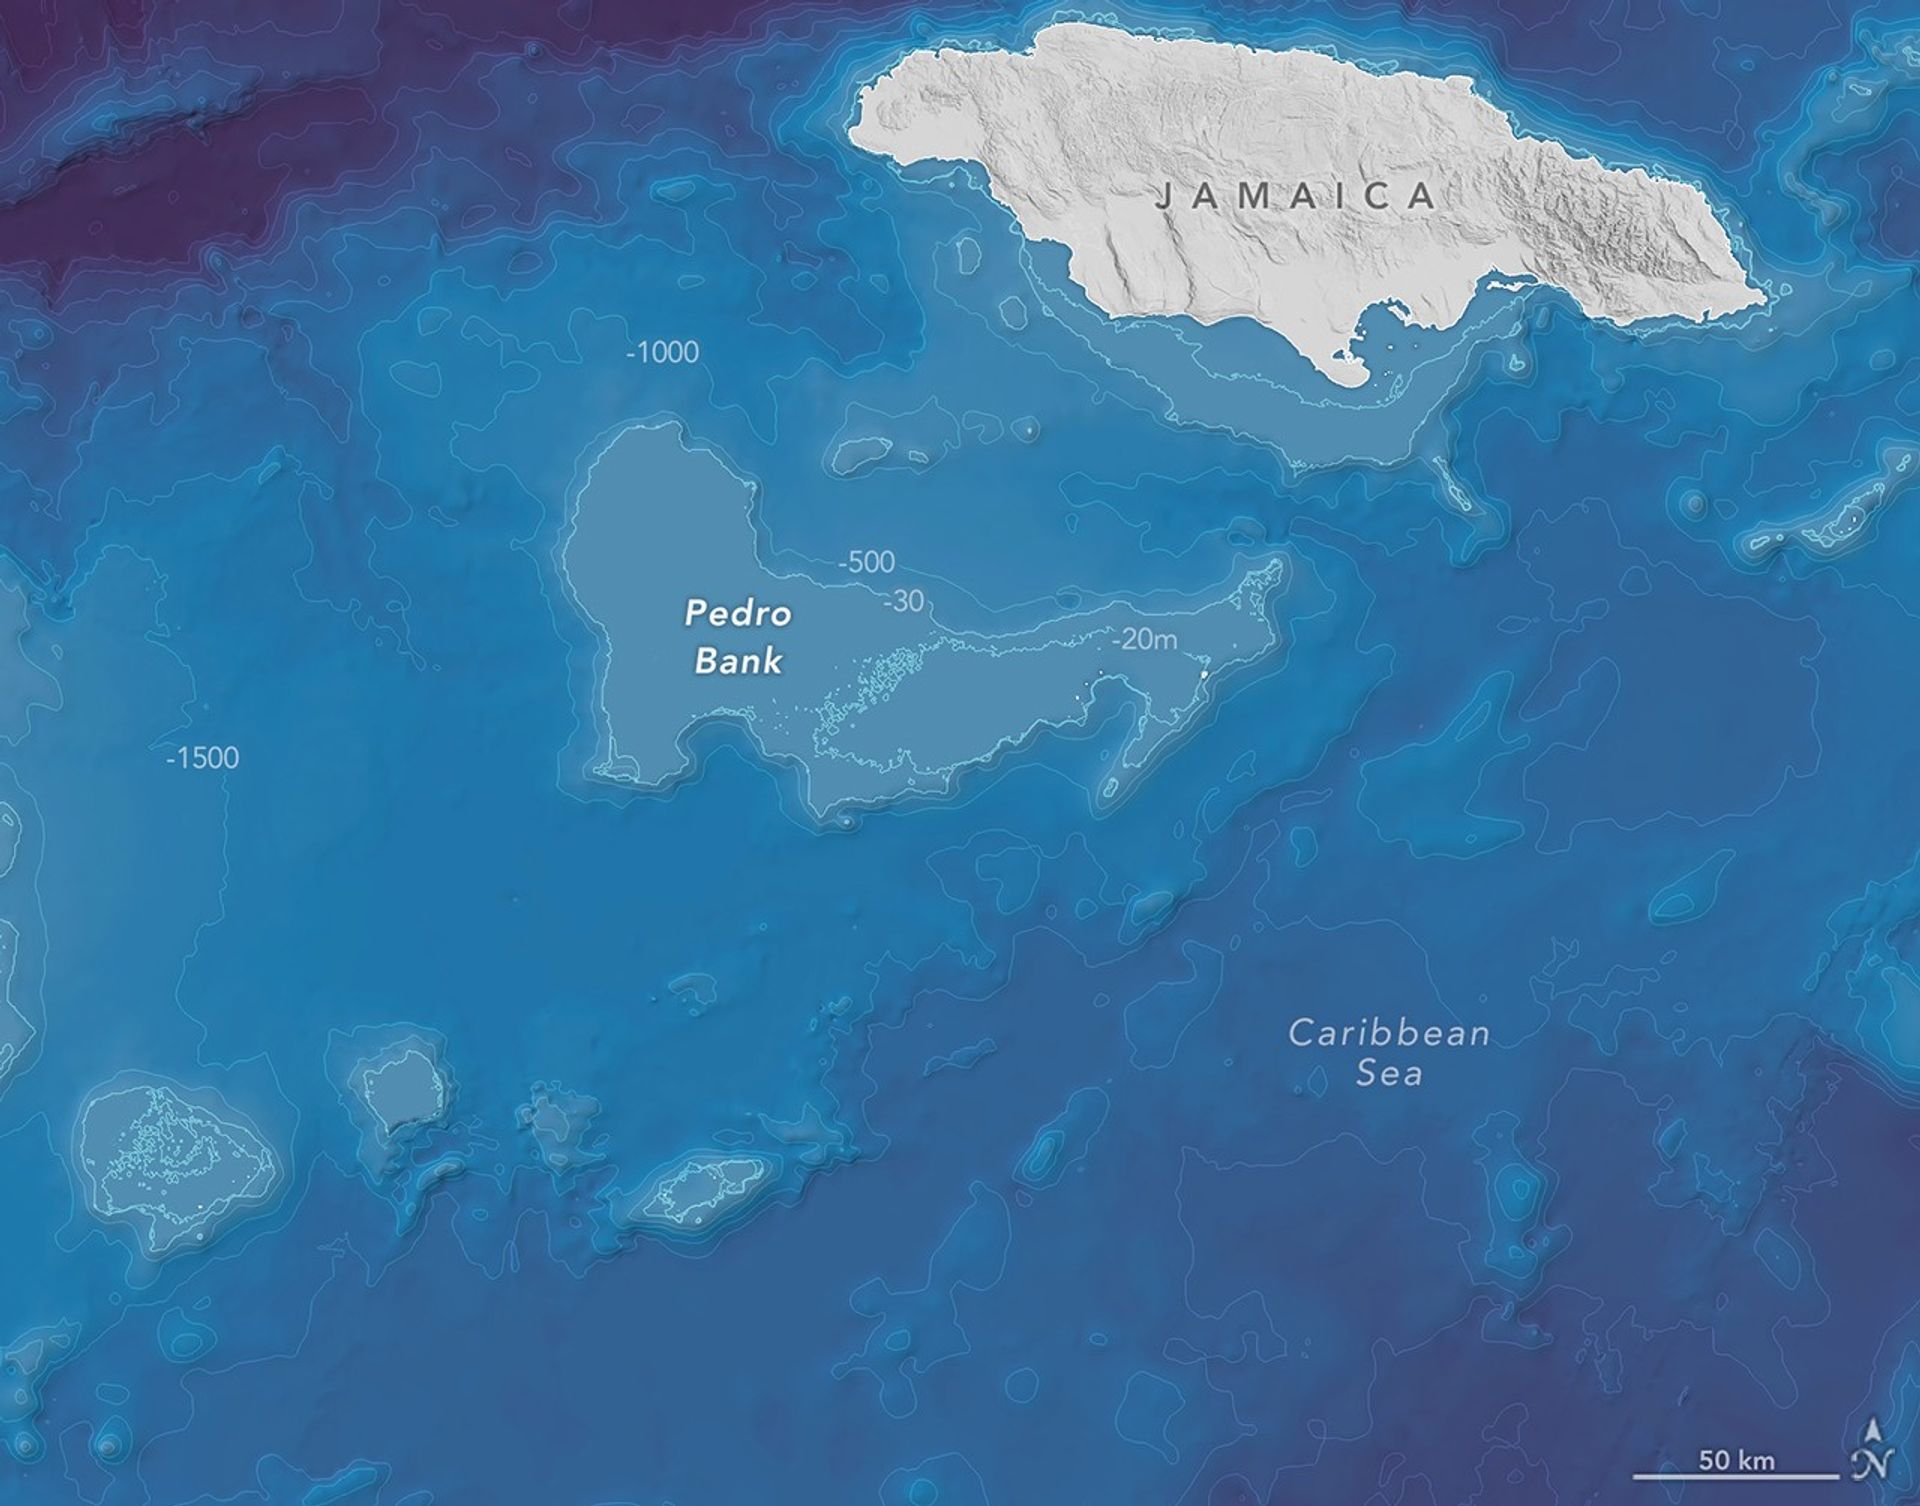
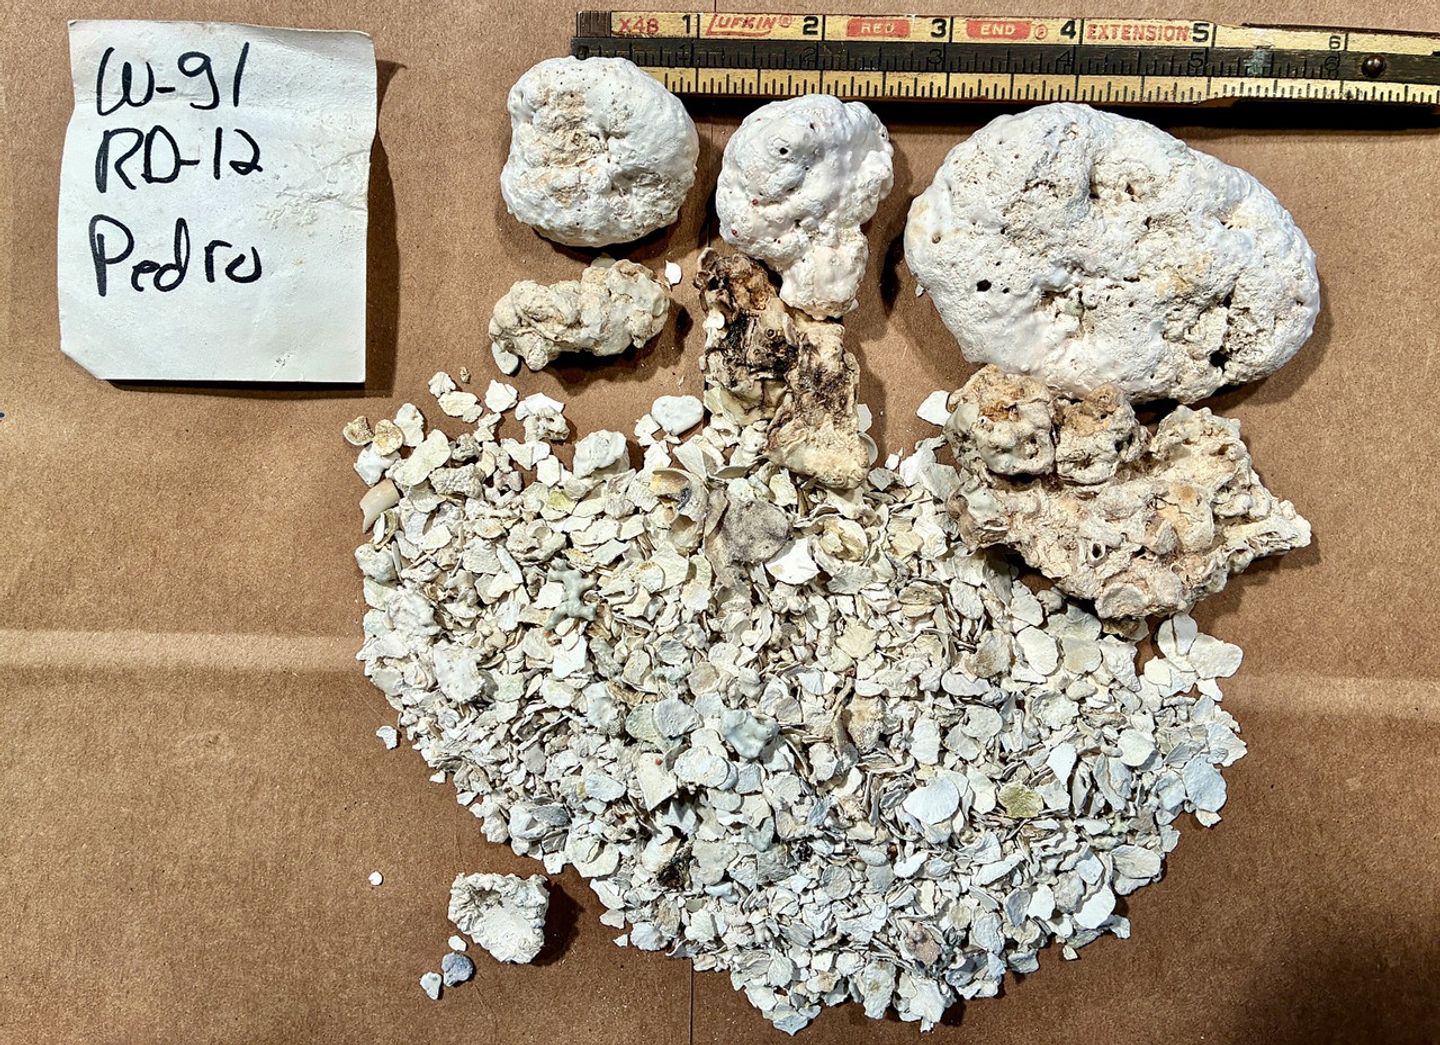
Sediment suspension was visible on Pedro and other nearby shallow banks, indicating that Melissa affected a total area of about 37,500 square kilometers—more than three times the area of Jamaica—on October 30, said sedimentologist Jude Wilber, who tracked the plume’s progression using multiple satellite sensors. Having studied carbonate sediment transport for decades, he believes the Pedro Bank event was the largest observed in the satellite era. “It was extraordinary to see the sediment dispersed over such a large area,” he said.
The sediment acted as a tracer, illuminating currents and eddies near the surface. Some extended into the flow field of the Caribbean Current heading west and north, while other patterns suggested the influence of Ekman transport, Wilber said. The scientists also noted complexities in the south-flowing plume, which divided into three parts after encountering several small reefs. Sinking sediment in the easternmost arm exhibited a cascading stair-step pattern.
Like in other resuspension events, the temporary coloration of the water faded after about seven days as sediment settled. But changes to Pedro Bank itself may be more long-lasting. “I suspect this hurricane was so strong that it produced what I would call a ‘wipe’ of the benthic ecosystem,” Wilber said. Seagrasses, algae, and other organisms living on and around the bank were likely decimated, and it is unknown how repopulation of the area will unfold.
Perhaps most consequentially for Earth’s oceans, however, is the effect of the sediment suspension event on the planet’s carbon cycle. Tropical cyclones are an important way for carbon in shallow-water marine sediments to reach deeper waters, where it can remain sequestered for the long term. At depth, carbonate sediments will also dissolve, another important process in the oceanic carbon system.
Near-continuous ocean observations by satellites have enabled greater understanding of these events and their carbon cycling. Acker and Wilber have worked on remote-sensing methods to quantify how much sediment reaches the deep ocean following the turbulence of tropical cyclones, including recently with Hurricane Ian over the West Florida Shelf. Now, hyperspectral observations from NASA’s PACE (Plankton, Aerosol, Cloud, ocean Ecosystem) mission, launched in February 2024, are poised to build on that progress, Acker said.
The phenomenon at Pedro Bank following Hurricane Melissa provided a singular opportunity to study this and other complex ocean processes—a large natural experiment that could not be accomplished any other way. Researchers will be further investigating a range of physical, geochemical, and biological aspects illuminated by this occurrence. As Wilber put it: “This event is a whole course in oceanography.”
NASA Earth Observatory images by Michala Garrison, using MODIS data from NASA EOSDIS LANCE and GIBS/Worldview, and ocean bathymetry data from the British Oceanographic Data Center’s General Bathymetric Chart of the Oceans (GEBCO). Photo by Jude Wilber. Story by Lindsey Doermann.
References & Resources
- Acker, J.G. and Wilber, R.J. (2025) The first 25 years of satellite carbonate sedimentology: What have we learned? The Depositional Record, 11(3), 975-997. In: Kump, L.R., Ingalls, M., and Hine, A.C. (eds) Carbonate depositional environments: Past and future questions—A Tribute to the career of E.A. Shinn.
- Acker, J.G. and Wilber, R.J. (2024) Satellite-Derived Estimates of Suspended CaCO3 Mud Concentrations from the West Florida Shelf Induced by Hurricane Ian. Environmental Sciences Proceedings, 29(1):69.
- EBSCO Research Starters (2024) Carbonate Compensation Depths. Accessed January 9, 2026.
- NASA Earth Observatory (2025, November 25) A Direct Hit on Jamaican Forests. Accessed January 9, 2026.
- NASA Earth Observatory (2023, April 6) Stirring Up Carbonate in the Coral Sea. Accessed January 9, 2026.
You may also be interested in:
Stay up-to-date with the latest content from NASA as we explore the universe and discover more about our home planet.

The major hurricane steered clear of land but delivered tropical storm conditions to coastal areas along its path.

Hurricane Melissa left the island nation’s forests brown and battered, but they won’t stay that way for long.

The Guiana Shield’s rugged terrain shapes Guyana’s waterways, but mining has altered their clarity.
The post A Plume of Bright Blue in Melissa’s Wake appeared first on NASA Science.

Fire Threatens Rare Forests in Argentina
Jan. 12th, 2026 05:01 am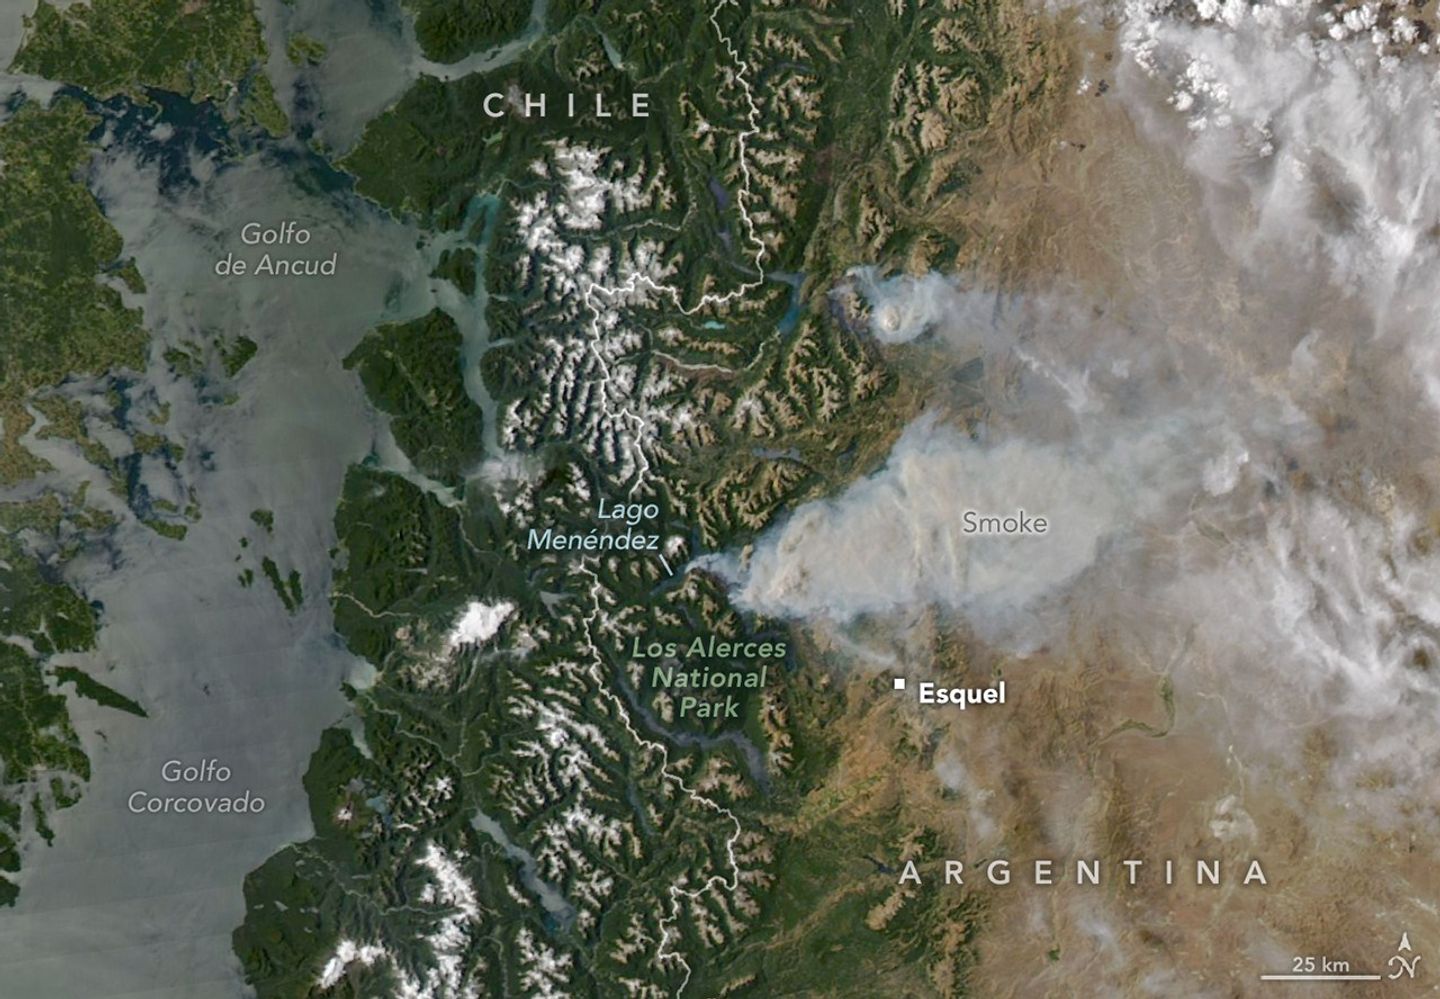
Summer is usually peak tourism season in Argentina’s Chubut province, a time when hikers and sightseers arrive to explore glacial lakes and cirques, alpine valleys, and towering forests. In January 2026, however, some visitors to the remote Patagonian region instead found themselves fleeing raging wildland fires.
On January 8, 2026, the MODIS (Moderate Resolution Imaging Spectroradiometer) on NASA’s Aqua satellite captured this image of smoke billowing from two large fires burning in and around Los Alerces National Park, a UNESCO World Heritage site. NASA satellites began detecting widespread fire activity in the area on January 6.
The more southerly blaze was spreading east on ridges between Lago Rivadavia, Lago Futalaufquen, and Lago Menéndez; the more northerly fire was burning on steep hillsides around Lago Epuyén. All of the lakes occupy U-shaped glacial troughs, valleys with unusually flat bases and steep sides carved by glacial and periglacial erosion. Satellite-based estimates from the Global Wildfire Information System indicate that fires charred more than 175 square kilometers (67 square miles) across Patagonia between January 5 and 8.
The ridges are blanketed with temperate Patagonian Andean forest, including sections of Valdivian rainforest, with rare stands of alerce (Fitzroya cupressoides). A type of cypress, these huge, slow-growing conifers are the second-longest-lived trees on Earth, with some surviving for more than 3,600 years. According to UNESCO documents, Los Alerces National Park protects 36 percent of Argentina’s alerce forests, including stands with the greatest genetic variability on the eastern slopes of the Andes. The park’s forests also contain exclusive genetic variants and the oldest individuals in the country.
News outlets and the national park reported challenging weather conditions for firefighters on the ground, who faced high temperatures, low humidity, and strong winds in recent days. Standardized Precipitation Index data from the National Integrated Drought Information System show that unusually dry conditions over the past several months have likely primed vegetation to burn. News outlets reported that at least 3,000 tourists had to be evacuated from a lake resort near Lago Epuyén.
NASA Earth Observatory image by Michala Garrison, using MODIS data from NASA EOSDIS LANCE and GIBS/Worldview. Story by Adam Voiland.
References & Resources
- Argentina (2026) Parque Nacional Los Alerces. Accessed January 9, 2026.
- Buenos Aires Herald (2026, January 8) Wildfires in Patagonia: 3,000 tourists evacuated as flames consume Chubut forests. Accessed January 9, 2026.
- El Destape (2026, January 5) “Situación explosiva o extremadamente crítica”: alerta por posibles incendios en casi toda la Argentina en el verano. Accessed January 9, 2026.
- France24 (2026, January 7) 3,000 tourists evacuated as Argentine Patagonia battles wildfires. Accessed January 9, 2026.
- LM Neuquén (2026, January 8) Incendios forestales: los lugares habilitados para el turismo en la cordillera. Accessed January 9, 2026.
- NASA Earthdata (2026) Wildfires. Accessed January 9, 2026.
- Noticias Ambientales (2026, January 8) Alert for fires in Chubut: nearly 2000 hectares devastated, 3000 evacuated, and the fire doesn’t stop. Accessed January 9, 2026.
- ReliefWeb (2026, January 8) Argentina – Wildfires. Accessed January 9, 2026.
- UNESCO (2017) Los Alerces National Park. Accessed January 9, 2026.
You may also be interested in:
Stay up-to-date with the latest content from NASA as we explore the universe and discover more about our home planet.

The Bear Gulch fire spread through dense forest and filled skies with smoke in northwestern Washington state.
The fast-growing blaze charred more than 100,000 acres in the span of a week.

Far from large urban areas, Great Basin National Park offers unencumbered views of the night sky and opportunities to study…
The post Fire Threatens Rare Forests in Argentina appeared first on NASA Science.
Ganges Delta Under a Winter Shroud of Fog
Jan. 9th, 2026 05:00 am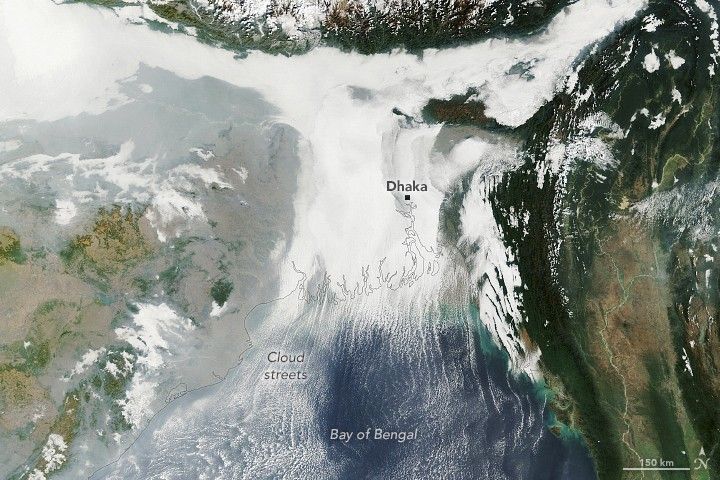
Winter weather took hold across the Indo-Gangetic Plain in early January 2026, bringing dense fog and cold temperatures to much of the flat, fertile lands that span from Pakistan and northern India to Bangladesh.
This image shows low-lying clouds over the delta on the morning of January 6, captured by the MODIS (Moderate Resolution Imaging Spectroradiometer) on NASA’s Terra satellite. Dense fog, particularly radiation fog, is common this time of year, forming when ground temperatures are cool, winds are light, and moisture is abundant near the surface. The meteorological departments of both Bangladesh and India called for moderate to very dense fog over the region that day amid an ongoing cold wave.
Other relatively low-level clouds extend from the land areas and over the Bay of Bengal. These long, parallel bands of clouds, known as cloud streets, can form when cold air passes over warmer open water, gaining heat and moisture. Rising thermals ascend until they reach a temperature inversion that acts like a lid, forcing the air to roll into long, parallel rotating cylinders. Clouds develop where the air rises, while clear skies appear where the air sinks.
While it appears scenic from above, foggy conditions can pose hazards and snarl daily life for people on the ground. For instance, dense fog early in the month caused major disruptions at the international airport in Dhaka, according to local news reports. Similar disruptions, along with travel delays on roads and railways, were reported in parts of northern, central, and eastern India.
NASA Earth Observatory image by Lauren Dauphin, using MODIS data from NASA EOSDIS LANCE and GIBS/Worldview. Story by Kathryn Hansen.
References & Resources
- Bangladesh Meteorological Department (2026, January 5) Weather Forecast Valid For 120 Hours Commencing 06 PM of 05.01.2026. Accessed January 8, 2026.
- Dhaka Tribune (2026, January 2) Flights diverted one after another as dense fog disrupts Dhaka airport operations. Accessed January 8, 2026.
- India Meteorological Department (2026, January 5) Press Release. Accessed January 8, 2026.
- NASA Earth Observatory (2024, January 18) Fog Blankets the Indo-Gangetic Plain. Accessed January 8, 2026.
- The New Indian Express (2026, January 4) Cold wave persist in Delhi, northern India, flights disrupted amid dense fog. Accessed January 8, 2026.

You may also be interested in:
Stay up-to-date with the latest content from NASA as we explore the universe and discover more about our home planet.
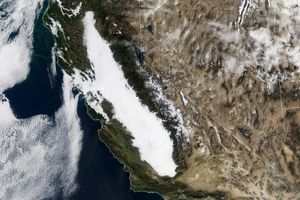
The right combination of conditions allowed this distinctive low cloud to form in California’s Central Valley for weeks.

Scientists say the seasonal crop fires are burning later in the day than in previous years.

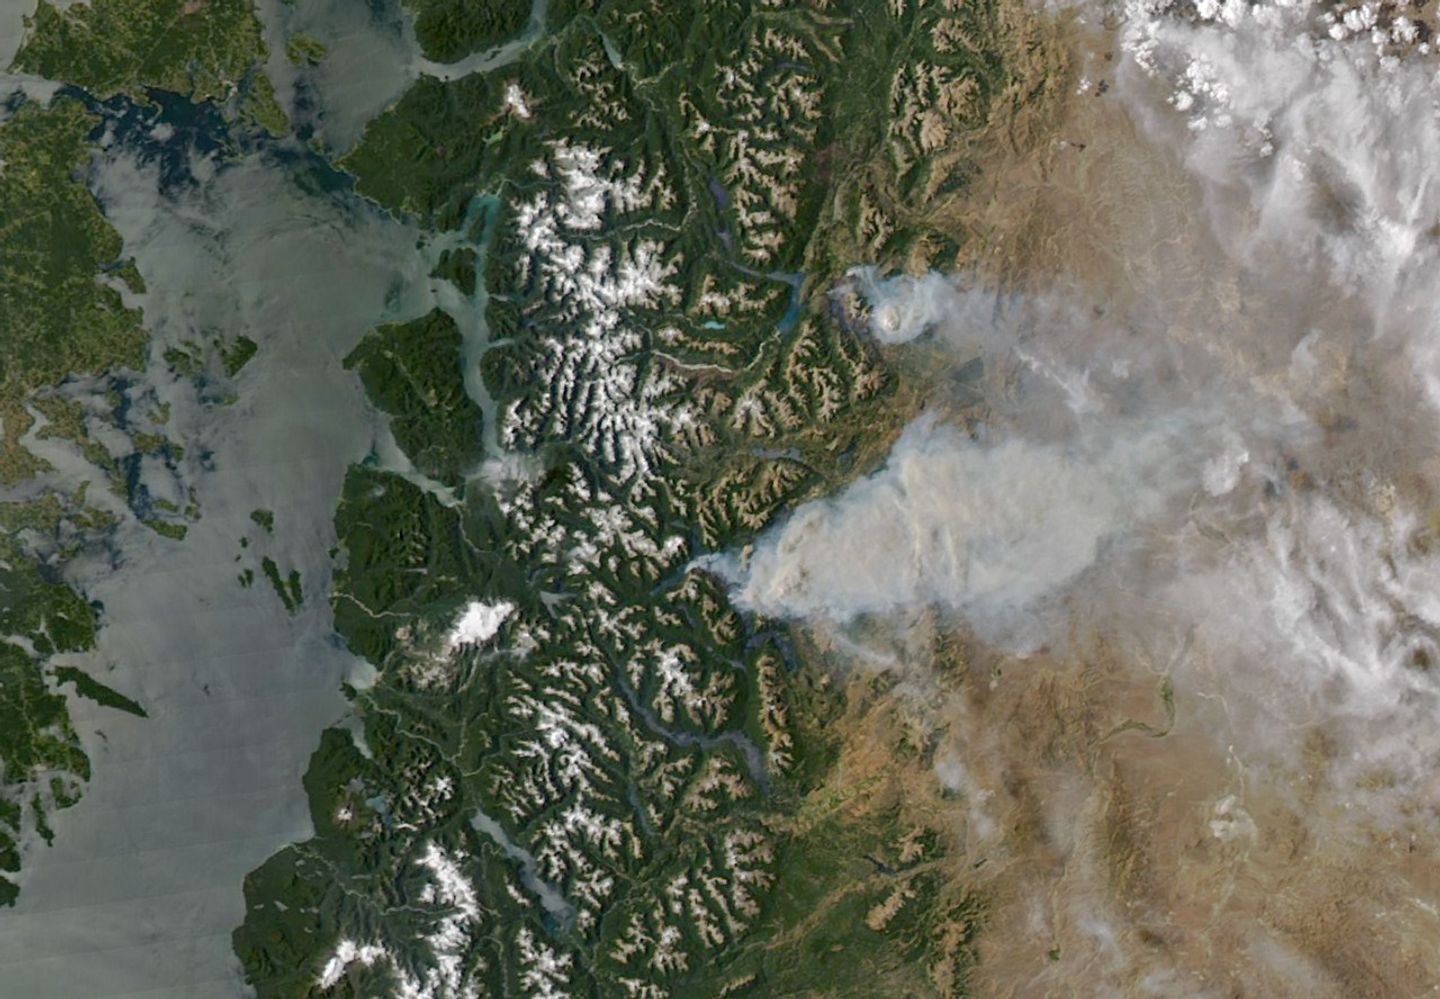
A prolonged high-pressure weather system brought unusually warm September temperatures to British Columbia and the Pacific Northwest.
The post Ganges Delta Under a Winter Shroud of Fog appeared first on NASA Science.
Meltwater Turns Iceberg A-23A Blue
Jan. 8th, 2026 05:01 am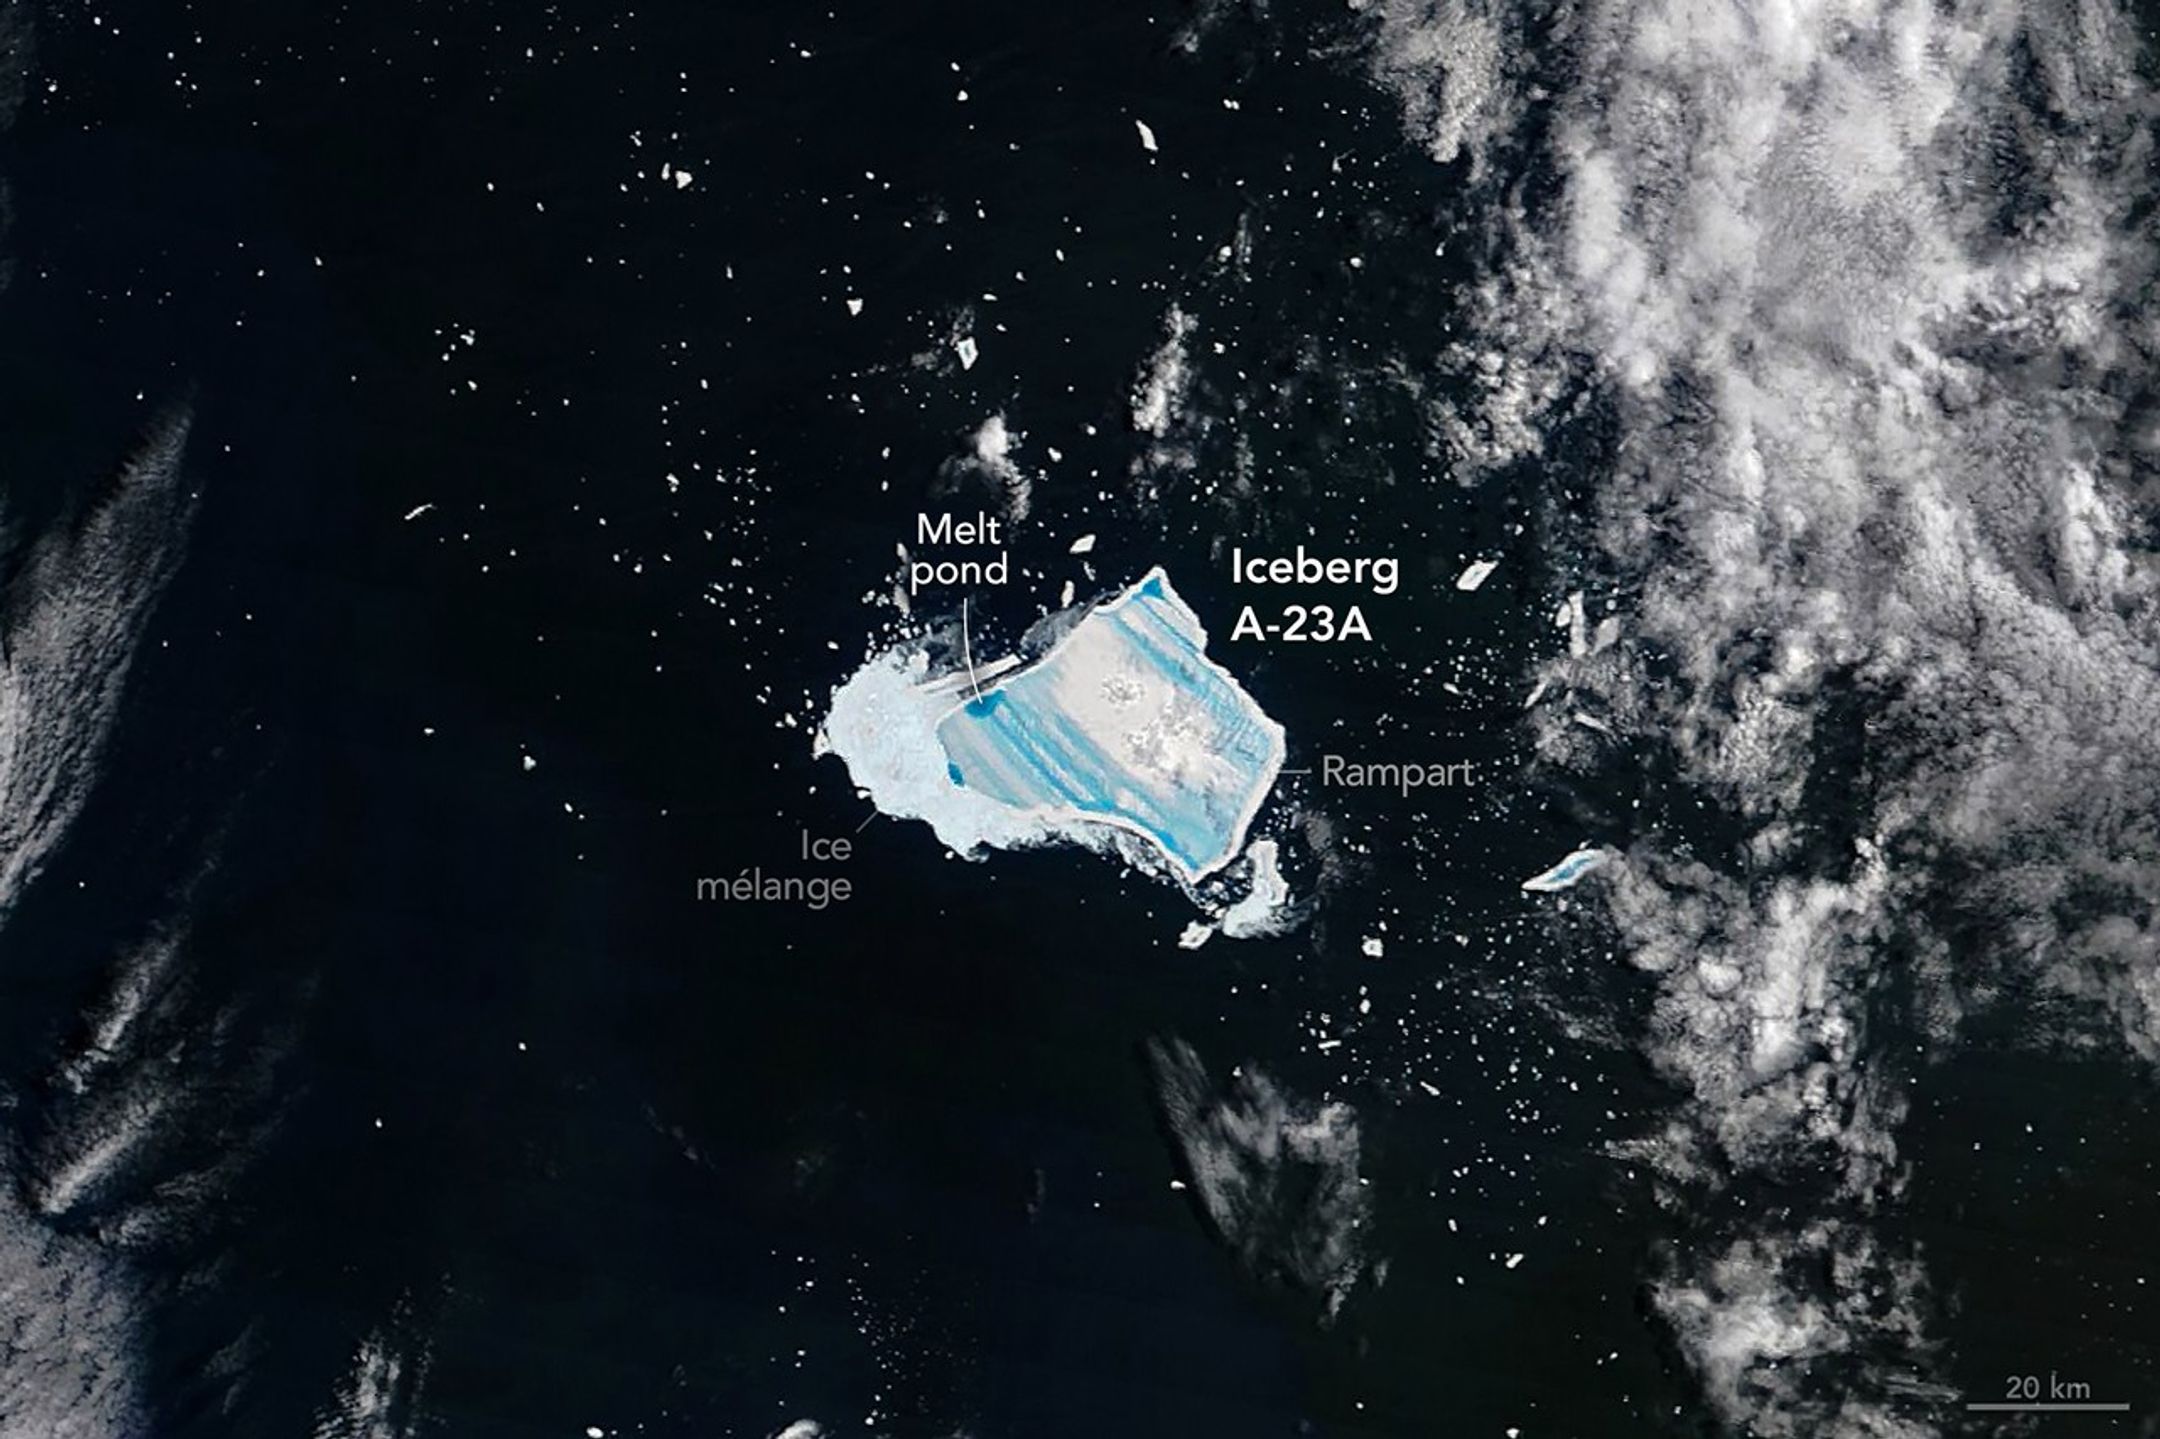
The year that iceberg A-23A first broke away from Antarctica’s Filchner Ice Shelf, Ronald Reagan was president of the United States, and the movie Top Gun was setting box office records. Forty years later, the massive tabular berg—one of the largest and longest-lived bergs ever tracked by scientists—is sopping with blue meltwater and on the verge of complete disintegration as it drifts in the South Atlantic between the eastern tip of South America and South Georgia island.
When it first detached from Antarctica in 1986, the berg was nearly twice the size of Rhode Island—about 4,000 square kilometers. Estimates from the U.S. National Ice Center put the berg’s area at 1,182 square kilometers (456 square miles) in early January 2026, following the breakup of several sizable pieces in July, August, and September of 2025 as it moved into relatively warm summer conditions by December.
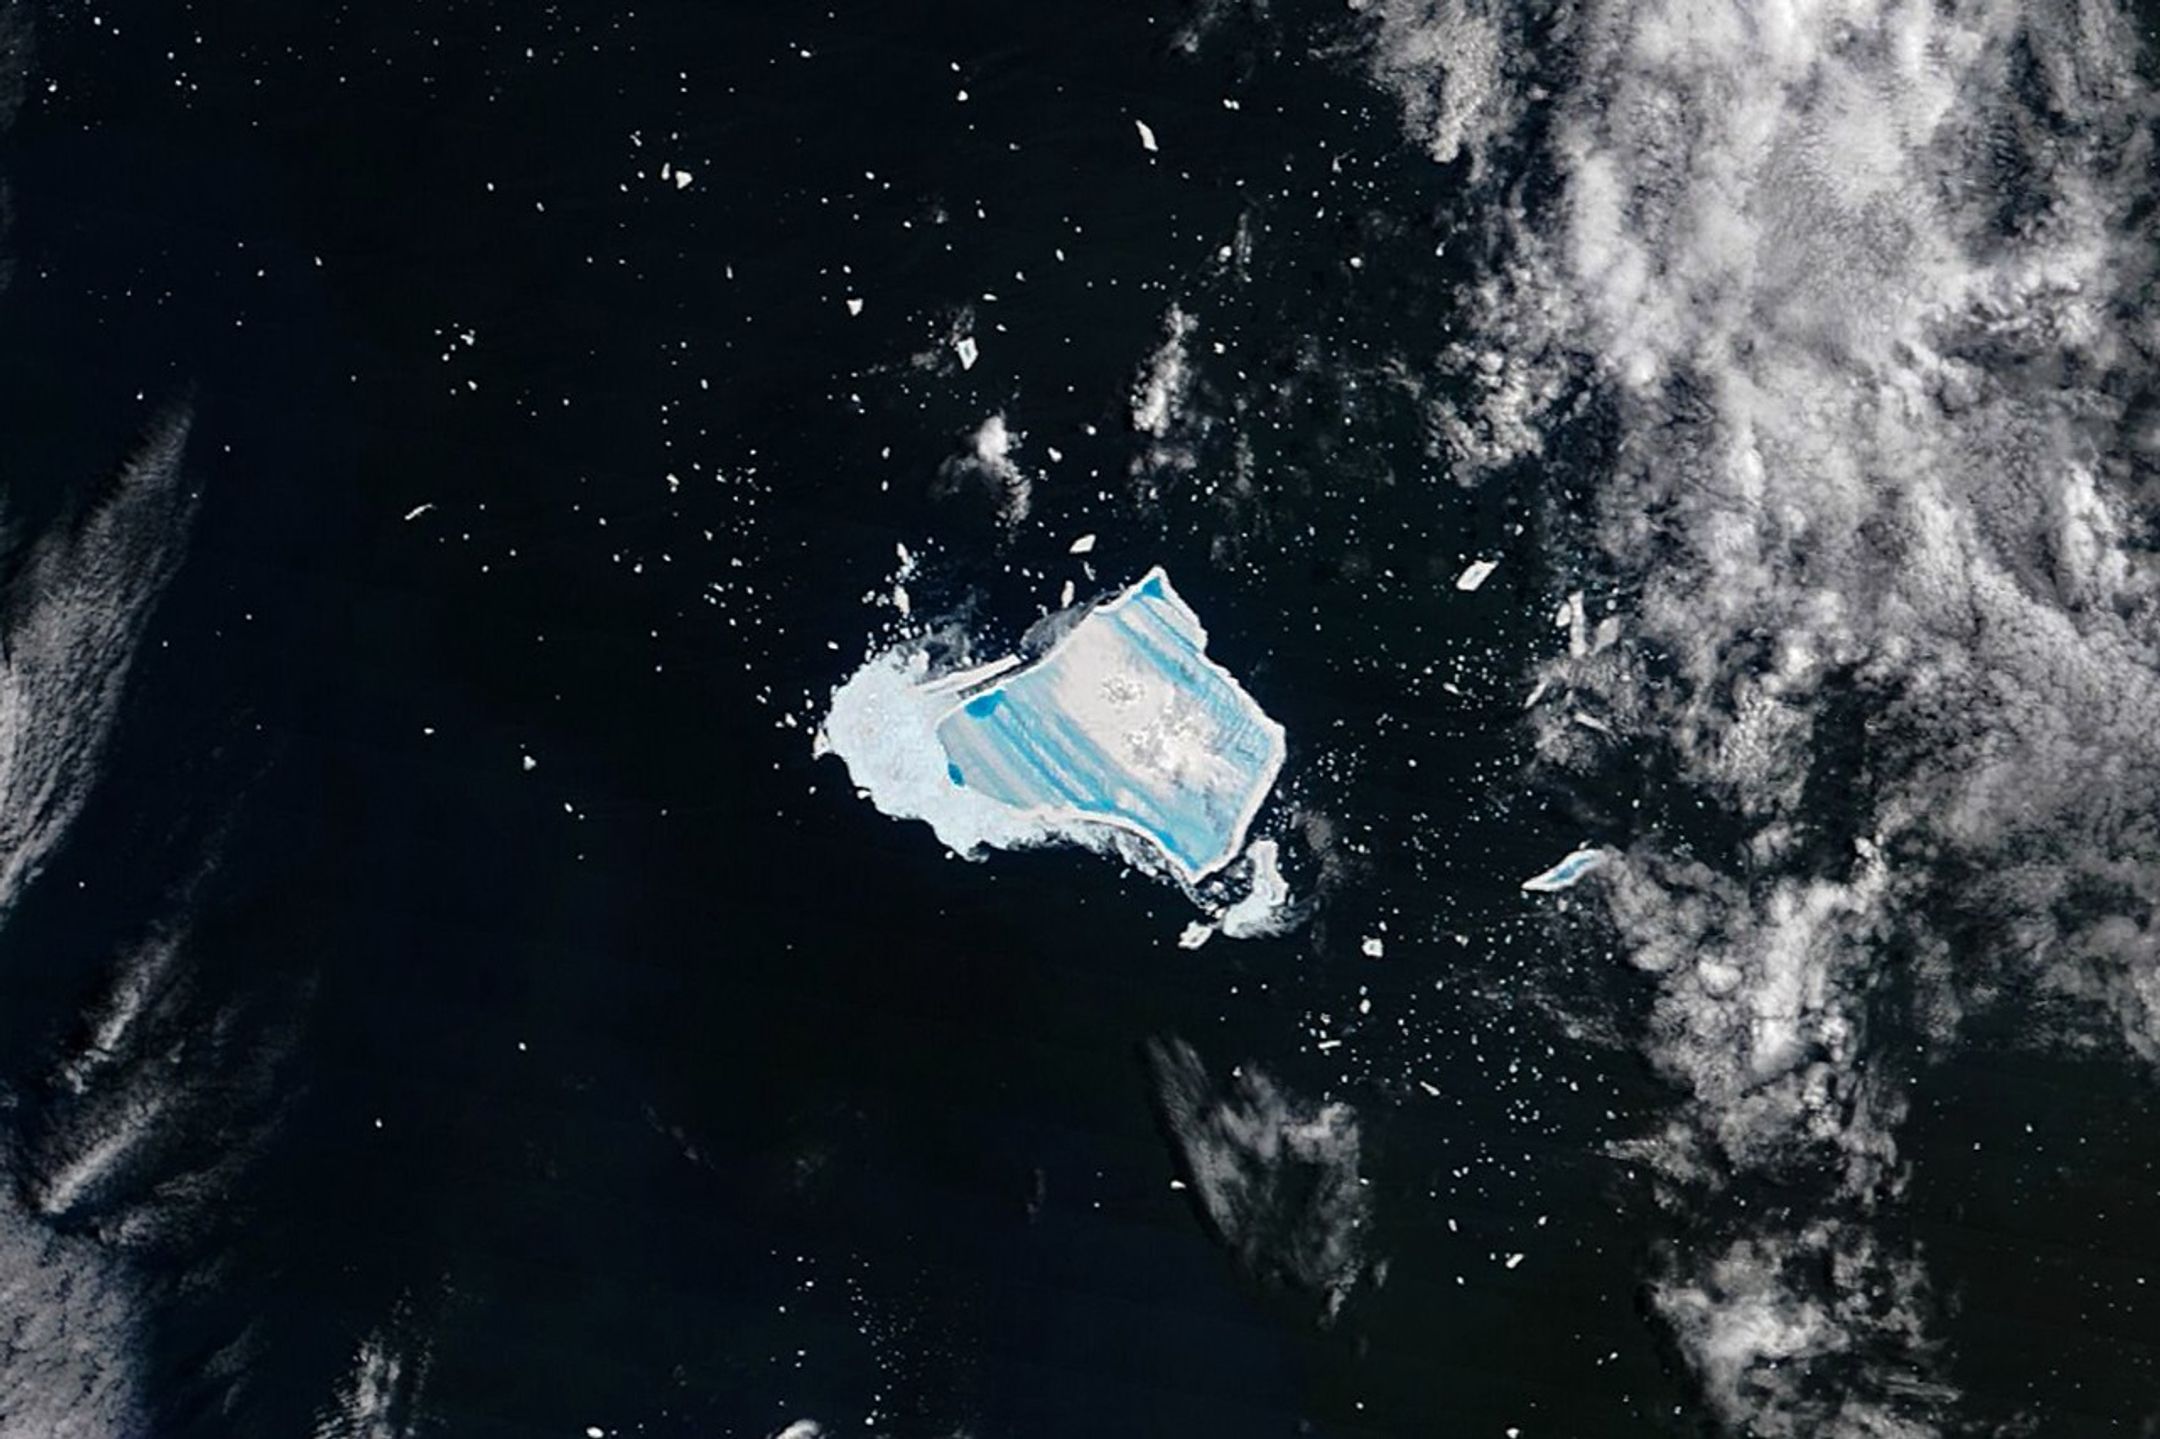
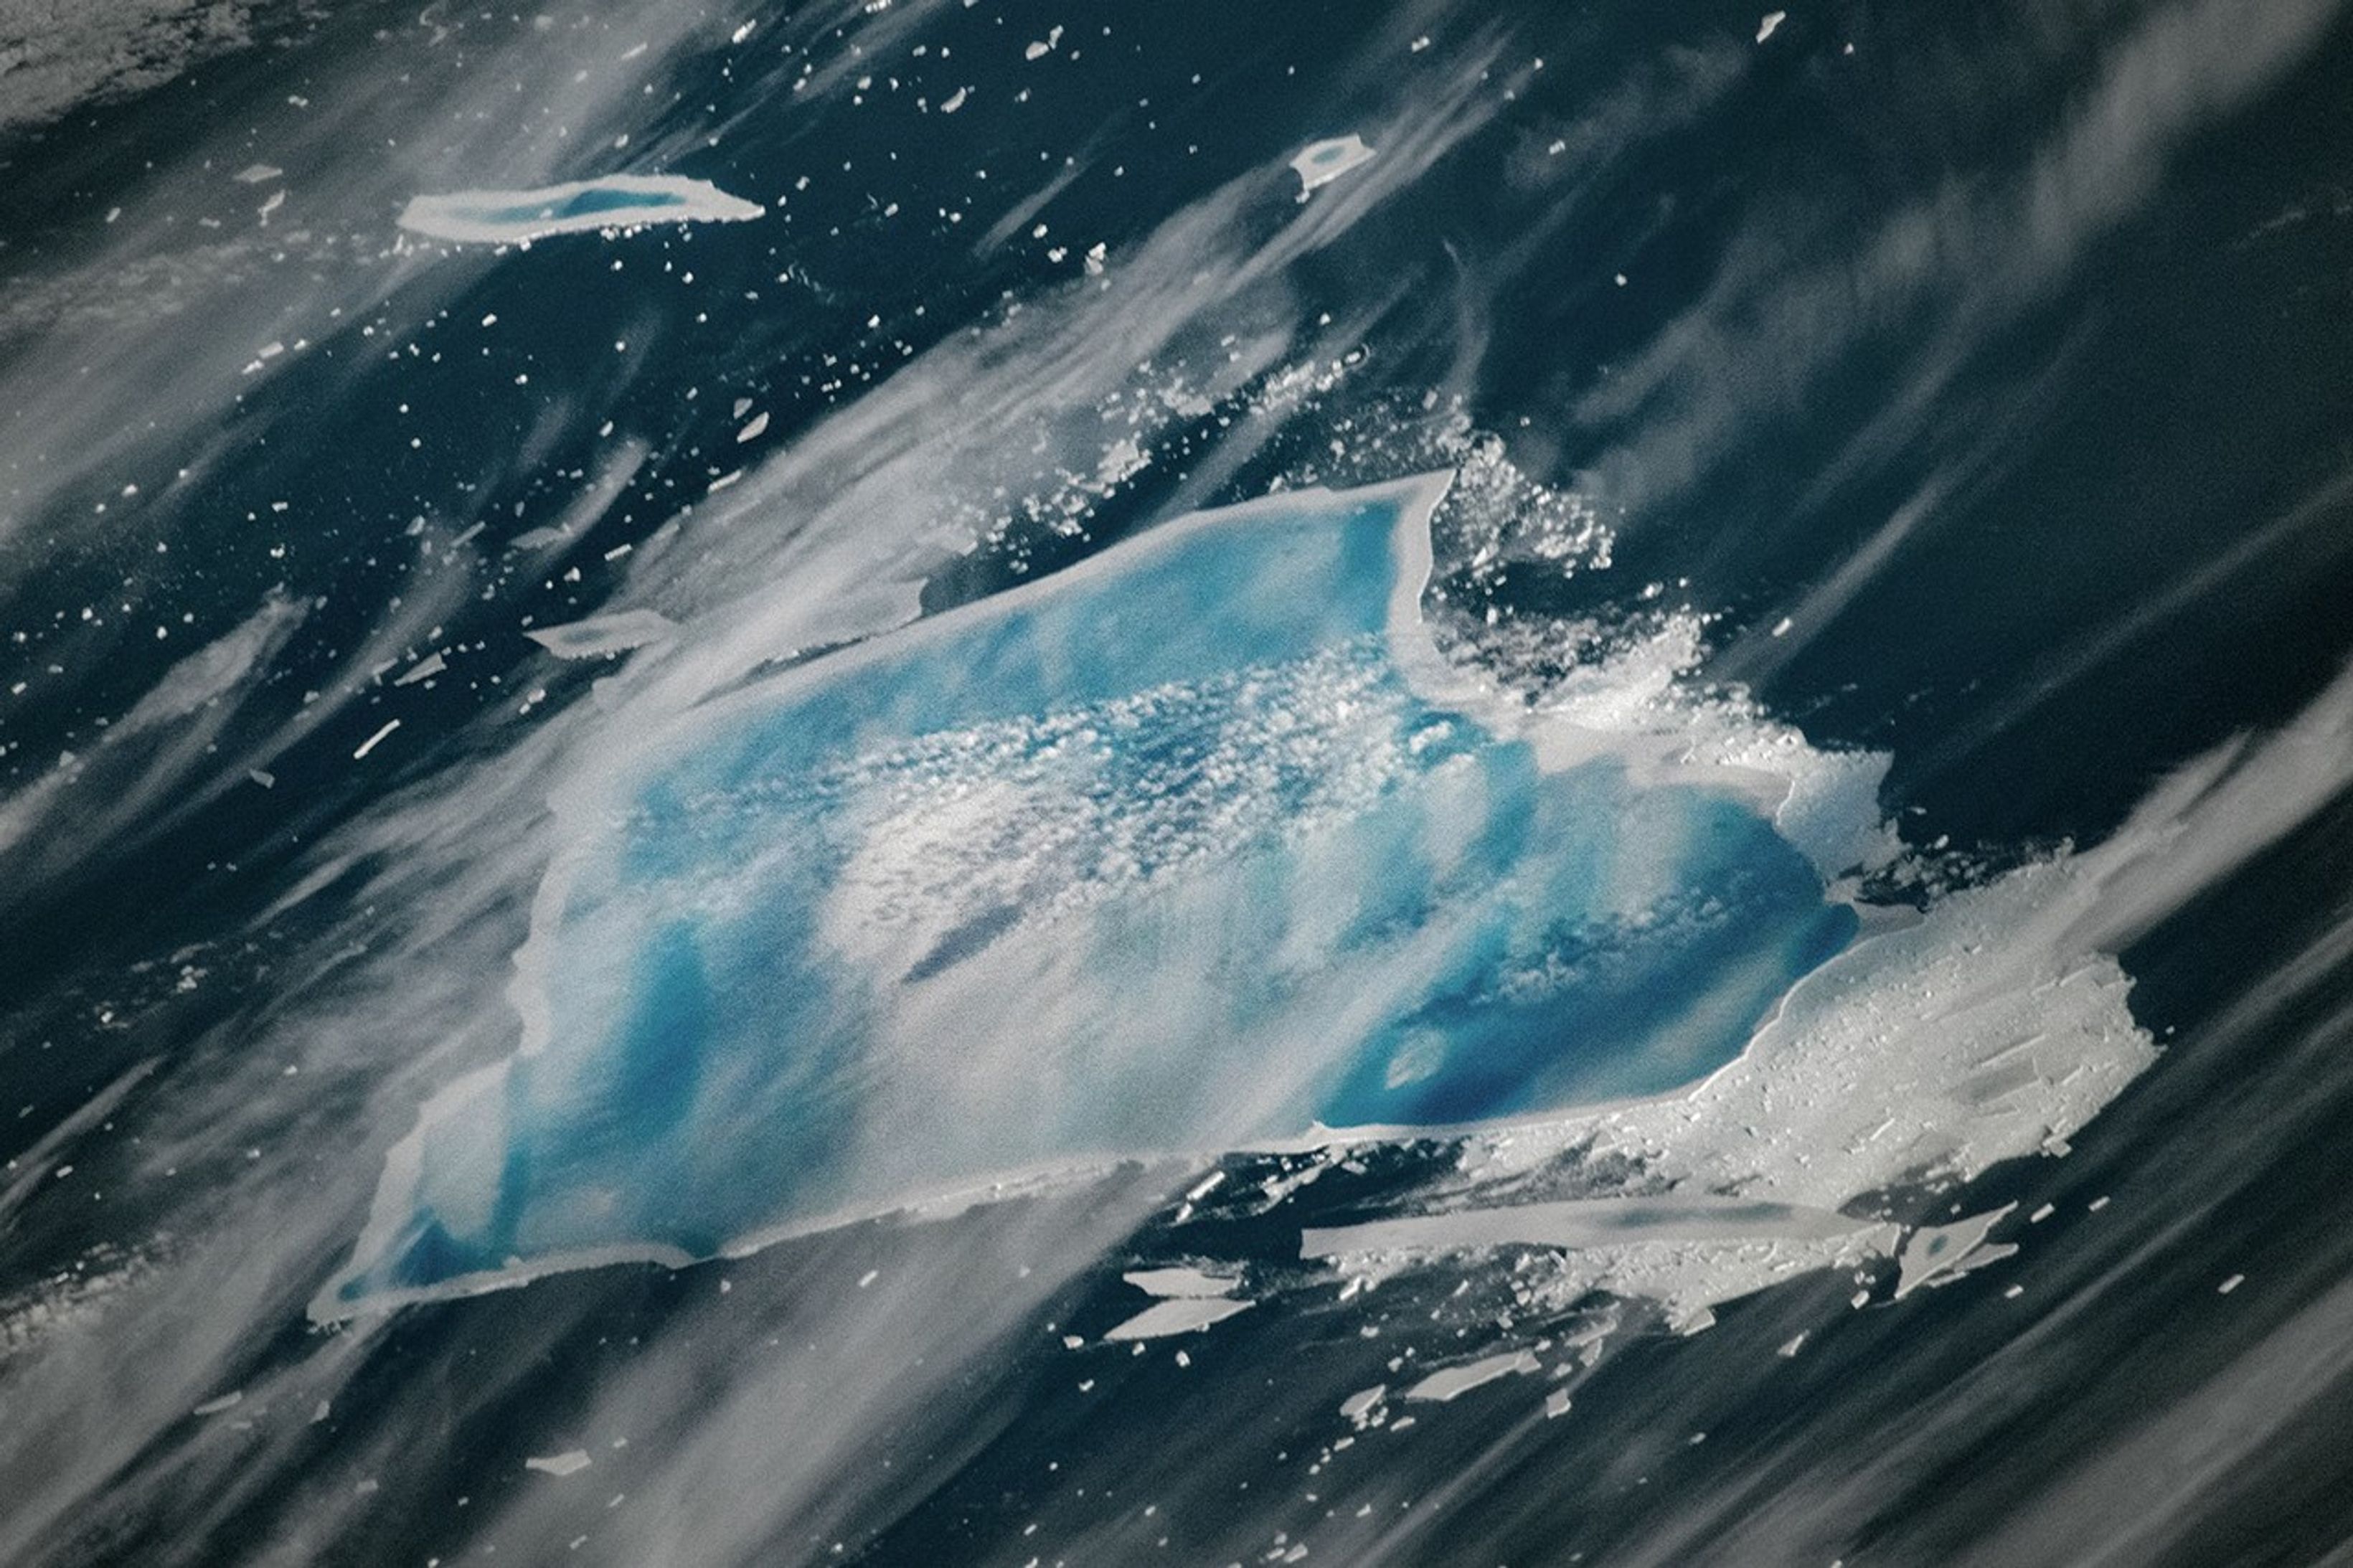
When the MODIS (Moderate Resolution Imaging Spectroradiometer) on NASA’s Terra satellite captured this image of what remained of the waterlogged berg on December 26, 2025, extensive pools of blue meltwater were visible on its surface. Though much smaller than it once was, what remains is still among the largest icebergs in the ocean, covering an area larger than New York City. An astronaut aboard the International Space Station captured a photograph showing a closer view (below) of the iceberg a day later, with an even more extensive melt pool.
The “blue-mush” areas are likely the result of ongoing disintegration events, explained Ted Scambos, a senior research scientist at the University of Colorado Boulder. “You have the weight of the water sitting inside cracks in the ice and forcing them open,” he said. Note also the thin white line around the outer edge of the iceberg seemingly holding in blue meltwater—a “rampart-moat” pattern caused by an upward bending of the iceberg plate as its edges melt at the waterline.
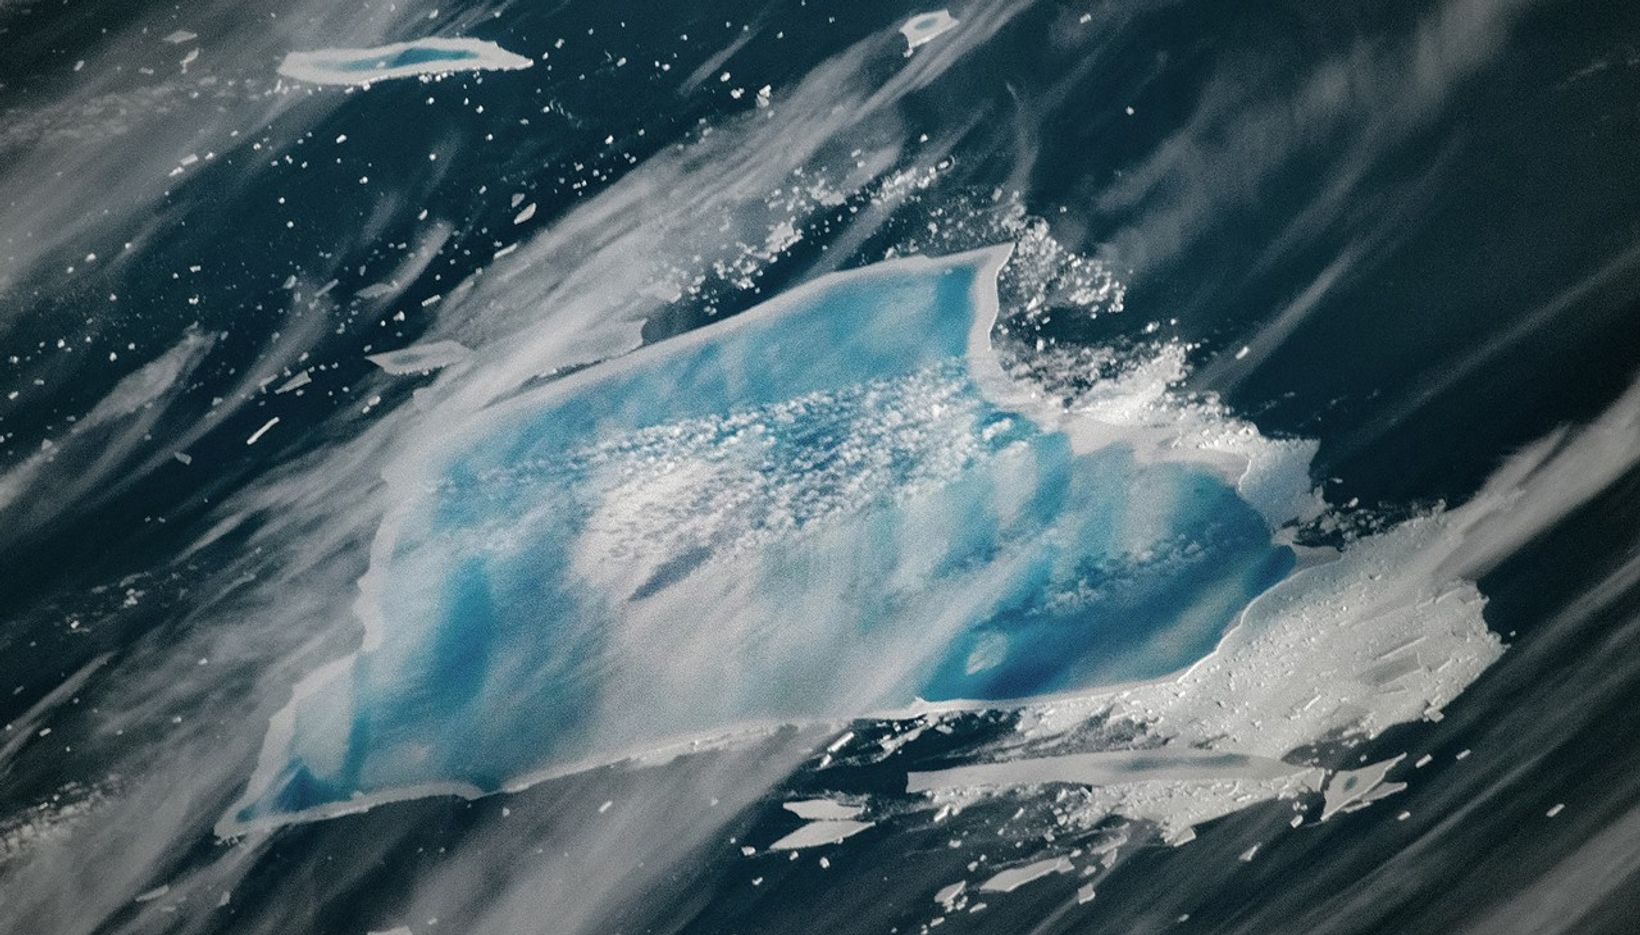
The striking linear patterns of blue and white across the berg are likely related to striations that were scoured hundreds of years ago when the ice was part of a glacier dragging across Antarctic bedrock.
“The striations formed parallel to the direction of flow, which ultimately created subtle ridges and valleys on the top of the iceberg that now direct the flow of meltwater,” explained Walt Meier, a senior research scientist at the National Snow & Ice Data Center. “It’s impressive that these striations still show up after so much time has passed, massive amounts of snow have fallen, and a great deal of melting has occurred from below,” added retired University of Maryland Baltimore County scientist Chris Shuman.
The MODIS image suggests that the ailing iceberg has also sprung a leak. The white area to its left may be the result of what Shuman described as a “blowout.” The weight of the water pooling at the top of the towering iceberg would have created enough pressure at the edges to punch through. The blowout may have allowed meltwater to spill tens of meters down to the ocean surface in what researchers call a “freshwater discharge plume,” where it mixed with the mélange of ice bits floating next to the iceberg.
Scientists say these signs indicate the iceberg could be just days or weeks from disintegrating completely. “I certainly don’t expect A-23A to last through the austral summer,” said Shuman, noting that the season typically brings clearer skies and warmer air and water temperatures—factors that accelerate the disintegration process in an area known among ice experts as a “graveyard” for icebergs. It’s already in water that’s about 3 degrees Celsius and riding currents that are pushing it toward even warmer waters that will eat away at it quickly, added Meier.
Even by Antarctic standards, A-23A has had a long, winding journey full of unexpected chapters that have improved scientists’ understanding of the “megabergs” occasionally released into the Southern Ocean. After grounding in the shallow waters of the Weddell Sea for more than 30 years, A-23A broke free in 2020, then spent several months in a twirling ocean vortex called a Taylor column. It eventually spun away and headed north, nearly colliding with South Georgia island and lodging in shallow waters for several months before escaping into the open ocean, where it has been rapidly breaking apart throughout 2025.
Scientists who have been tracking the berg for their entire careers see its imminent demise as a bittersweet moment. “I’m incredibly grateful that we’ve had the satellite resources in place that have allowed us to track it and document its evolution so closely,” said Shuman. “A-23A faces the same fate as other Antarctic bergs, but its path has been remarkably long and eventful. It’s hard to believe it won’t be with us much longer.”
Even as A-23A fades, other massive bergs are parked or drifting along the Antarctic shoreline. Several, including A-81, B22A, and D15A, are each larger than 1,500 square kilometers and sit waiting for their moment to break free and begin their journey north.
NASA Earth Observatory image by Michala Garrison, using MODIS data from NASA EOSDIS LANCE and GIBS/Worldview. ISS Astronaut photograph ISS074-E-8943 was acquired on December 27, 2025, with a Nikon Z 9 digital camera using a focal length of 500 millimeters. It is provided by the ISS Crew Earth Observations Facility and the Earth Science and Remote Sensing Unit at NASA Johnson Space Center. The image was taken by a member of the Expedition 74 crew. The image has been cropped and enhanced to improve contrast, and lens artifacts have been removed. The International Space Station Program supports the laboratory as part of the ISS National Lab to help astronauts take pictures of Earth that will be of the greatest value to scientists and the public, and to make those images freely available on the Internet. Additional images taken by astronauts and cosmonauts can be viewed at the NASA/JSC Gateway to Astronaut Photography of Earth. Story by Adam Voiland.
References and Resources
- AP News (2025, September 4) Most enduring and biggest iceberg breaks apart, with more splintering to come in its death spiral. Accessed January 7, 2026.
- British Antarctic Survey (2025, March 4) World’s largest iceberg grounds near sub-Antarctic Island of South Georgia. Accessed January 7, 2026.
- NASA Earth Observatory (2025, September 24) A Giant Iceberg’s Final Drift. Accessed January 7, 2026.
- NASA Earth Observatory (2025, August 1) Antarctic Iceberg Downsizes. Accessed January 7, 2026.
- NASA Earth Observatory (2025, May 6) Antarctic Iceberg Loses Its Edge. Accessed January 7, 2026.
- NASA Earth Observatory (2015, February 6) Flipped, Dirty, Amazing Icebergs. Accessed January 7, 2026.
- NPR (2025, September 5) The world’s oldest and largest iceberg will soon be no more. Accessed January 7, 2026.
- Scambos, T., et al. (2025) How to train your iceberg: Iceberg A23a drift track in 2024. Bulletin of the American Meteorological Society, 106(8), S357–S400.
- Scambos, T., et al. (2005) ICESat profiles of tabular iceberg margins and iceberg breakup at low latitudes. Geophysical Research Letters, 32(23).
- USA Today (2025, September 4) World’s largest iceberg, A23a, breaks. See satellite and aerial views. Accessed January 7, 2026.
- U.S. National Ice Center (2026, January 7) Antarctic Iceberg Data. Accessed January 7, 2026.
You may also be interested in:
Stay up-to-date with the latest content from NASA as we explore the universe and discover more about our home planet.

After a long, turbulent journey, Antarctic Iceberg A-23A is signaling its demise as it floats in the South Atlantic.

Iceberg A-23A continued to lose sizable pieces of ice during the 2025 austral winter, but it remained the planet’s largest…

Sea ice around the southernmost continent hit one of its lowest seasonal highs since the start of the satellite record.
The post Meltwater Turns Iceberg A-23A Blue appeared first on NASA Science.
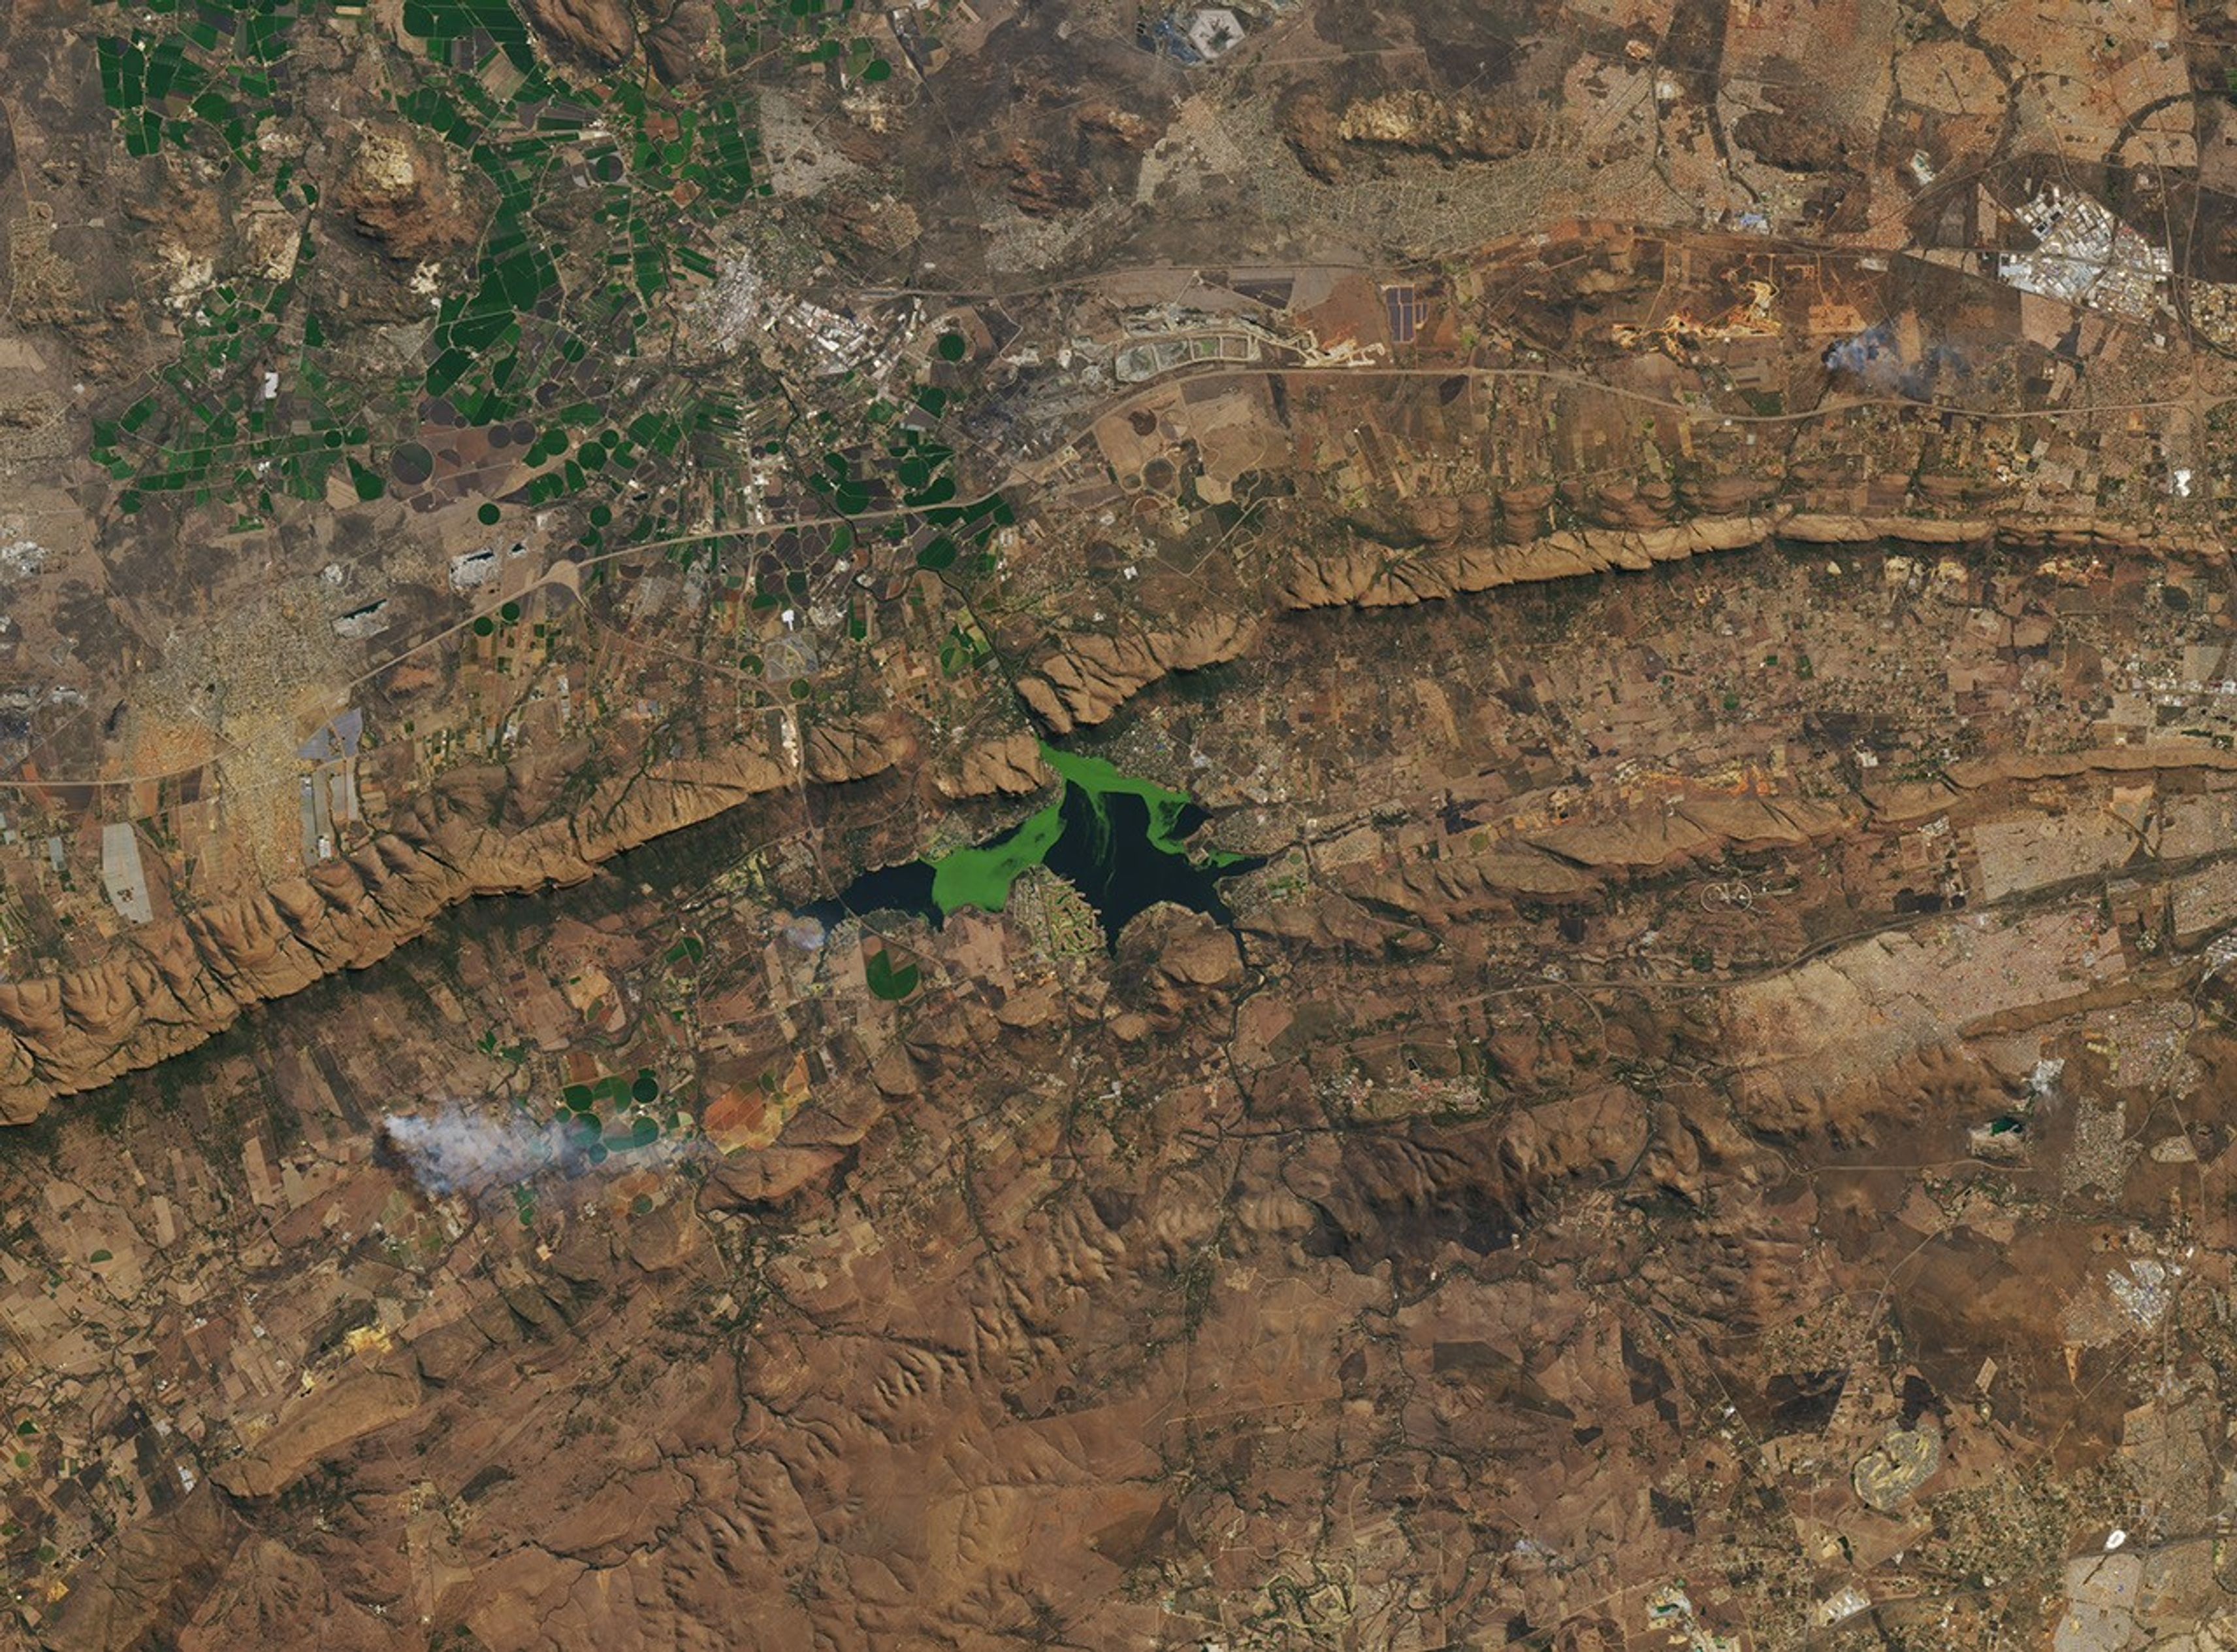
Plants and Algae Swirl Across a South African Reservoir
Jan. 7th, 2026 05:00 amOn clear days in Hartbeespoort, South Africa, satellite images often reveal a reservoir with shades of deep blue interrupted by drifting patches of vivid green. Over the years, these shifting features have included algae blooms—which can affect water quality, ecosystems, and nearby human communities—along with several types of invasive aquatic plants.
In this animation, from June 2022 to July 2023, aquatic plants proliferate, move around the reservoir, and then fade. The animation is composed of images from Harmonized Landsat and Sentinel-2 (HLS), a NASA product that combines imagery from the NASA/USGS Landsat 8 and Landsat 9 satellites and the European Space Agency’s Sentinel-2A, 2B, and 2C satellites.
The green masses can also contain varying amounts of algae, an umbrella term for photosynthetic organisms that live in water, encompassing everything from single-celled cyanobacteria to seaweed. They play a vital role in maintaining healthy ecosystems. But when colonies of algae spread too widely or release harmful toxins, they can threaten the very environments they support. These colonies are known as harmful algal blooms, or HABs.
Some HABs are toxic and often are part of a process called eutrophication. Eutrophication begins when there are too many nutrients in an ecosystem—because of agricultural runoff and other inputs—leading to a rapid growth of algae.
“It’s like having a garden,” said Bridget Seegers, a NASA scientist who studies cyanobacteria in freshwater ecosystems. “If you add a lot of nutrients, you’re going to have a lot of growth.”
Eventually, the algae die off. As decomposers break down the dead algae, they consume oxygen, which can lead to hypoxia and the formation of dead zones.
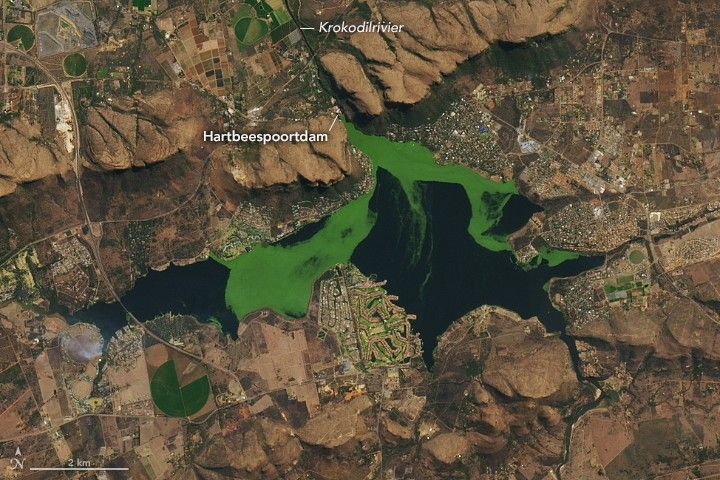
Such conditions have been documented at the Hartbeespoortdam (Hartbeespoort Dam) reservoir, located about 25 kilometers (16 miles) west of Pretoria and used primarily for recreation and irrigation. It also hosts large mats of invasive water hyacinths and, more recently, the invasive plant Salvinia minima. While these aquatic plants do not produce toxins, they do contribute to eutrophication when they die and decompose.
Harmful algal blooms can affect ecosystem health and human lives and livelihoods. In April 2023, South African authorities linked a large fish kill in Hartbeespoort to low oxygen levels caused by excessive algal growth. More broadly, HABs in drinking water reservoirs can reduce water availability and raise water treatment costs, while swimming in HAB-infested waters can cause rashes, and pets or livestock that drink it may fall ill or die.
One 2022 paper published in Remote Sensing examined algae in the reservoir from 1980 to 2020 using Landsat data. “This is a reservoir that has always been monitored heavily by the local department of water resources,” said Adam Ali, the lead author of the paper. The research used satellite data to provide a big-picture view of conditions across the entire reservoir over long time scales. Using 40 years of Landsat data, the researchers found that the biggest drivers of algal growth were total phosphorus content—a nutrient found in runoff—and water temperature, with blooms typically expanding in the warm summer months and subsiding in the winter.
They also identified key trends over space and time. Algal productivity was higher near Krokodilrivier (Crocodile River) inflows and in the western part of the reservoir due to golf course runoff and restricted water circulation, demonstrating how HABs are influenced by runoff and river inputs. Large blooms occurred between 1982 and 1986, when total phosphorus levels were high. A bioremediation program in the late 1980s succeeded in limiting algae growth, but after funding ended in the late 1990s, harmful algal blooms spiked again in the early 2000s.
To track algae from space, the researchers analyzed the water’s color by measuring different wavelengths of light. From this, they estimated the concentration of chlorophyll-a, a common pigment in algae, and used these values to approximate algae biomass over time. Although water samples remain necessary to confirm that a bloom is harmful, satellite data can help scientists understand the drivers of harmful algal blooms, especially in remote regions where regular ground monitoring is expensive and time intensive.
New and forthcoming NASA missions promise to advance space-based water quality monitoring. The next Landsat satellite is expected to measure wavelengths specifically designed to detect HABs. NASA’s PACE (Plankton, Aerosol, Cloud, ocean Ecosystem) mission, launched in 2024, collects data in hundreds of precise wavelength bands in the visible spectrum, which can help scientists identify the type of algae that comprise a certain bloom—a key factor in determining toxicity. Given PACE’s spatial resolution, the data is most useful in coastal areas or larger inland water bodies. Ali is working with researchers at NASA Ames to integrate PACE into future studies.
Editor’s note: This story was updated on January 13, 2026, to note the presence of the plant Salvinia minima.
Animation by Ross Walter/Landsat Science Office Support, using data from the Harmonized Landsat and Sentinel-2 (HLS) product. HLS is funded by NASA and is a deliverable of the Satellite Needs Working Group (SNWG), an interagency effort of the U.S. Government dedicated to identifying and addressing Earth observation needs across U.S. civilian federal agencies. Still image by Lauren Dauphin/NASA Earth Observatory using Landsat data from the U.S. Geological Survey. Story by Madeleine Gregory/Landsat Science Office Support.
References & Resources
- Ali, K., et al. (2022) Integrating In Situ and Current Generation Satellite Data for Temporal and Spatial Analysis of Harmful Algal Blooms in the Hartbeespoort Dam, Crocodile River Basin, South Africa. Remote Sensing, 14(17), 4277.
- Coetzee, J.A., et al. (2022) Into Africa: Salvinia minima Baker (Salviniaceae) invades South Africa. BioInvasions Records, 11(14), 1011-1018.
- NOAA (2016, April 27) What is a harmful algal bloom? Accessed January 6, 2026.
- South African Government (2023, April 26) Water and Sanitation releases investigation report on cause of fish-kill at Hartbeespoort Dam. Accessed January 6, 2026.
You may also be interested in:
Stay up-to-date with the latest content from NASA as we explore the universe and discover more about our home planet.

A multi-year drought has put extra strain on farmers and water managers in the Middle Eastern country.

Drought in the Nueces River basin is reducing reservoir levels, leaving residents and industry in the Corpus Christi area facing…

Forests play a key role in filtering the waters of a reservoir in central Massachusetts that’s home to submerged towns…
The post Plants and Algae Swirl Across a South African Reservoir appeared first on NASA Science.